


August 2020 nesto-meter Report

August 18th 2020 – Chase Belair, Co-Founder and Principal Broker at nesto
As the planet slowly emerges from its first worldwide lockdown in history, and the homebuying market is climbing back up the slope, it’s time to introduce you to nesto’s latest creation: The nesto-meter.
Every month, we will be reporting on several key indicators, showcasing relevant and exclusive data we have compiled and harvested through our online application. From rate volatility and variances to purchase versus renewal versus refinance trends, and desired purchase prices versus available down payments, we want to provide a much closer look at the reality of the average digital mortgage shopper and paint a more precise picture of the market fluctuations they may face every month.
Beginning with this month’s review, we have collected data from pre- and post-lockdown stages, from January to July 2020.
Let’s see what we’ve got!
Key takeaways
- Rate volatility reached its peak in April 2020, primarily due to confinement measures. During Q1 & Q2 2020, the lowest fixed rates changed more often than the lowest variable rates.
- Since January 2020, in the span of only 3 weeks, Bank of Canada’s Prime rate dropped 3 times by half a percentage point – from 3.95% to 2.45%
- As purchase volumes were down from February to March 2020, they started slowly climbing back up for the following months, and through COVID-19 lockdown, reached a high of 60% of our application volume in June 2020.
- March 2020 saw a major increase in refinance applications – implying more homeowners chose to withdraw equity from their homes.
- Likely also a result of the pandemic, the application volume over the past few months displayed a general decrease in the desired target property value as well as in the available/desired down payment amounts.
1. RATES
a. Volatility
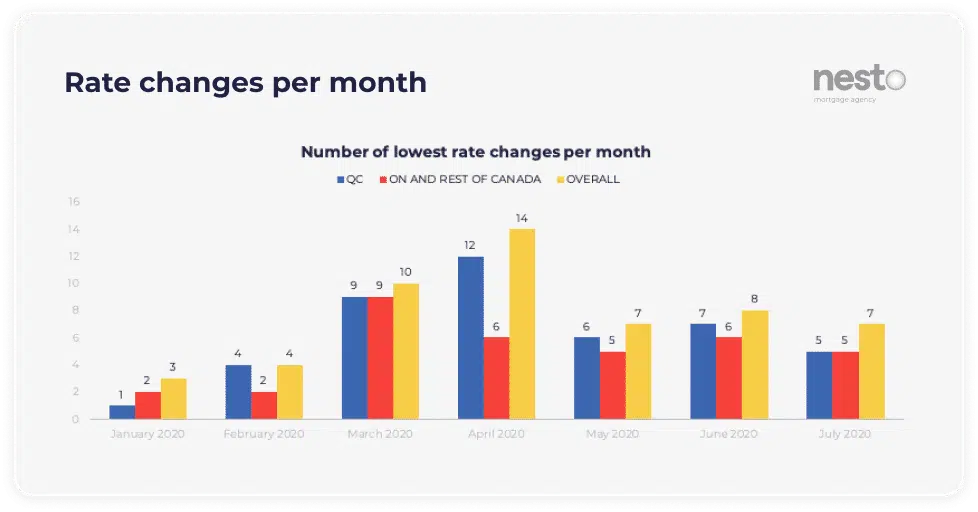
Fig.1: Number of times the lowest rates offered by nesto to its clients changed per month across provinces between January and July 2020. Lowest rates looked at were fixed and variable insured (5-19.99% down payment) as well as fixed and variable insurable (20%+ down payment) and correspond to the lowest rate nesto could offer its clients at the time.
Rate Volatility is the first key metric we decided to examine, taking all of our lowest (best available) rates for insured and insurable mortgages, both 5-year fixed and variable, and comparing their degree of variation from January to July 2020. The peak of volatility occurred in April 2020, which says a lot about the degree of uncertainty we’ve experienced during that time frame.
Overall, since January 2020, the lowest available rate changed 53 times, for an average of 7.57 times per month. At the height of the international health crisis, in April 2020, the lowest rates changed 14 times in the month – essentially every other day, sometimes even twice a day, revealing the insecurity of the market. In the last 2 months, even if Coronavirus lockdown measures have considerably decreased, our lowest mortgage rates changed on average 7 to 8 times a month.
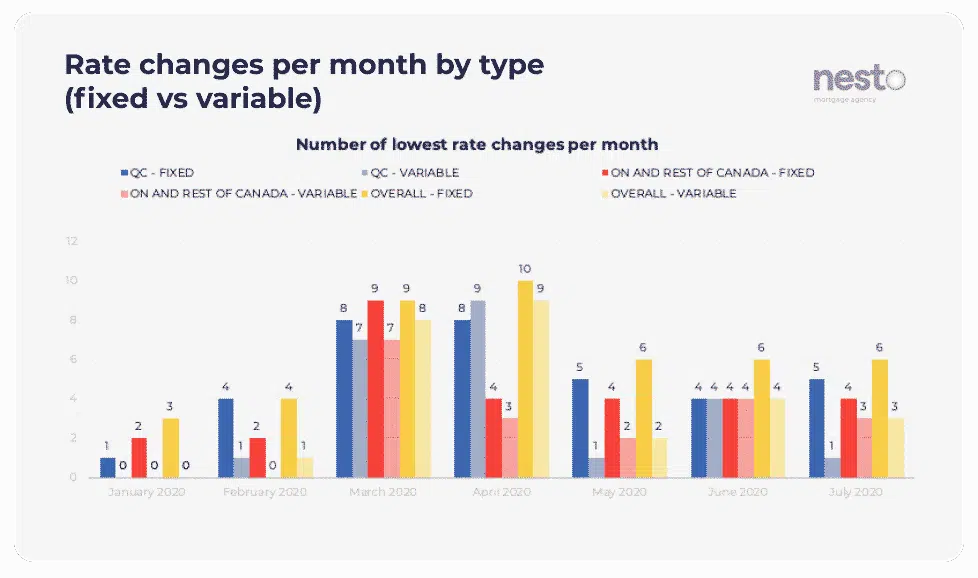
Fig.2: Number of times the lowest rates offered by nesto to its clients changed per month across provinces between January and July 2020 and comparing fixed to variable rates. Lowest rates looked at were fixed and variable insured (5-19.99% down payment) as well as fixed and variable insurable (20%+ down payment).
When looking specifically at the number of rate changes by type (fixed or variable), the fixed rates are the ones that changed the most often, across all provinces, from January to July 2020.
Note: It’s important to specify that the lowest rates “changing” can be due to the prime rate changing (for variable) or due to lenders modifying the rate (for fixed) or the discounts they offer from prime (for variable). This is different from “having” a variable mortgage and seeing your rate change.
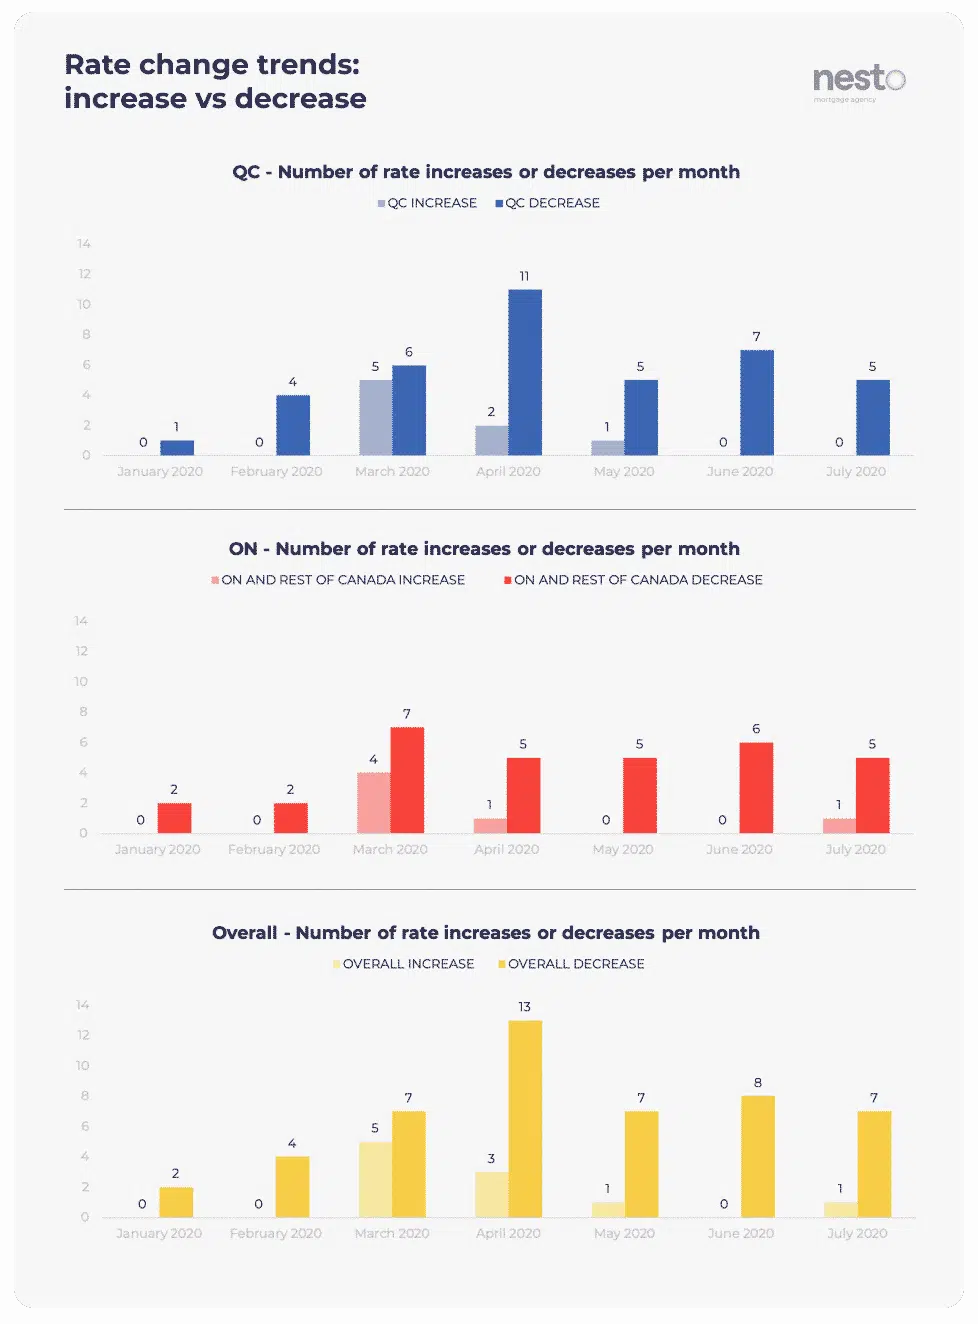
Fig.3: Number of times the lowest rates offered by nesto to its clients increased or decreased per month across provinces between January and July 2020. Lowest rates looked at were fixed and variable insured (5-19.99% down payment) as well as fixed and variable insurable (20%+ down payment).
When it comes to comparing data from different provinces, we notice there is a lot more rate volatility in Quebec than anywhere else in Canada, mostly attributable to the fact that there are fewer lenders in Quebec. In Ontario and the other provinces, if a lender increases their rate, odds are that another lender had the same rate and has not increased it yet, so nesto’s lowest rate will stay the same until all lenders adjust. In QC, when a lender increases their rate, there might not be another one with the exact same rate so nesto’s lowest rate automatically increases.
As we look at the number of increases versus decreases in rates per month, from January to July 2020, most rate changes were negative: fixed or variable rates going down. This is to be expected considering the current economic environment caused by the pandemic.
When confinement hit, at the end of March 2020, lenders quickly inflated their rates, intentionally pricing themselves out of the market as they dealt with the looming uncertainty and the influx of deferment requests from existing clients. Towards the middle to the end of lockdown, rates started dropping rapidly as lenders brought themselves back into the market, price-wise.
The only rate increase we have noticed since was at the end of July on a few variable-rate discounts. This could potentially indicate the popularity of variable rates with discounts off prime hovering between -1.15% and -0.75%. As of the time of writing this, the variable-rate discount has returned to July levels.
b. Variance
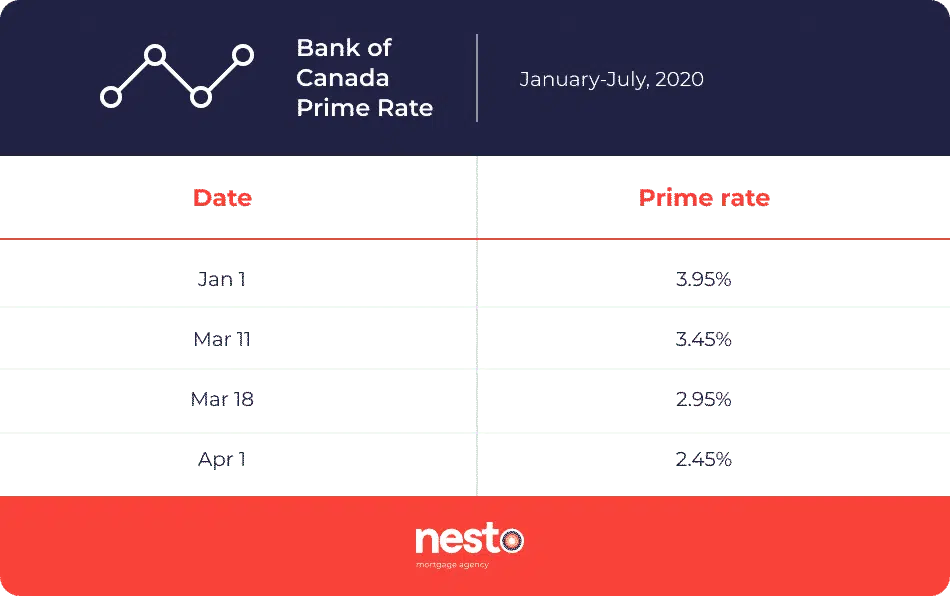
Prime Rate: Looking closer at the data, we noticed something quite unique happened with the Prime rate since January. While it generally fluctuates by .25%, in the span of 3 weeks, the rate dropped 3 times by .50%! This also means that clients with variable mortgages at “prime -1.25%” (pre-covid rate) would see their rates go as low as 1.20% (down from 2.70% when the mortgage originally funded)! This drop of 1.50% in such a short span is a clear demonstration of the government’s initiative to stimulate spending and reduce the burden of interest on existing loans that are based on the prime rate.
Table 1: The Bank of Canada’s Prime Rate decreased from 3.95% to 2.45% between January and April 2020, losing 1.50% overall. The rate decreases happened over the course of 3 weeks.
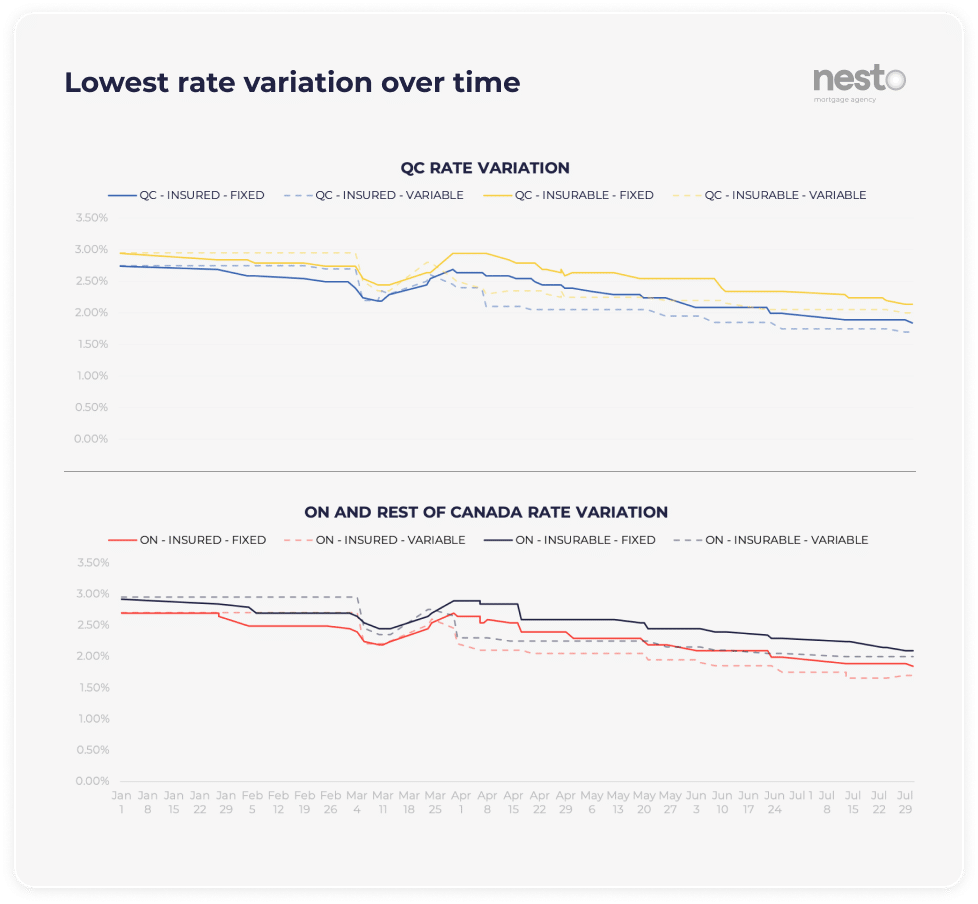
Fig.4: Variation of nesto’s lowest fixed and variable rates for insured and insurable mortgages by province from January to July 2020.
Lowest Rates: From January to July 2020, the best discounts from prime went from 0.8% to 1.05%. For example, in this 7-month span, the highest insured variable rate was at 2.75%, while the lowest was at 1.70% – a 1.05% difference.
How does such a difference affect a homeowner’s mortgage?
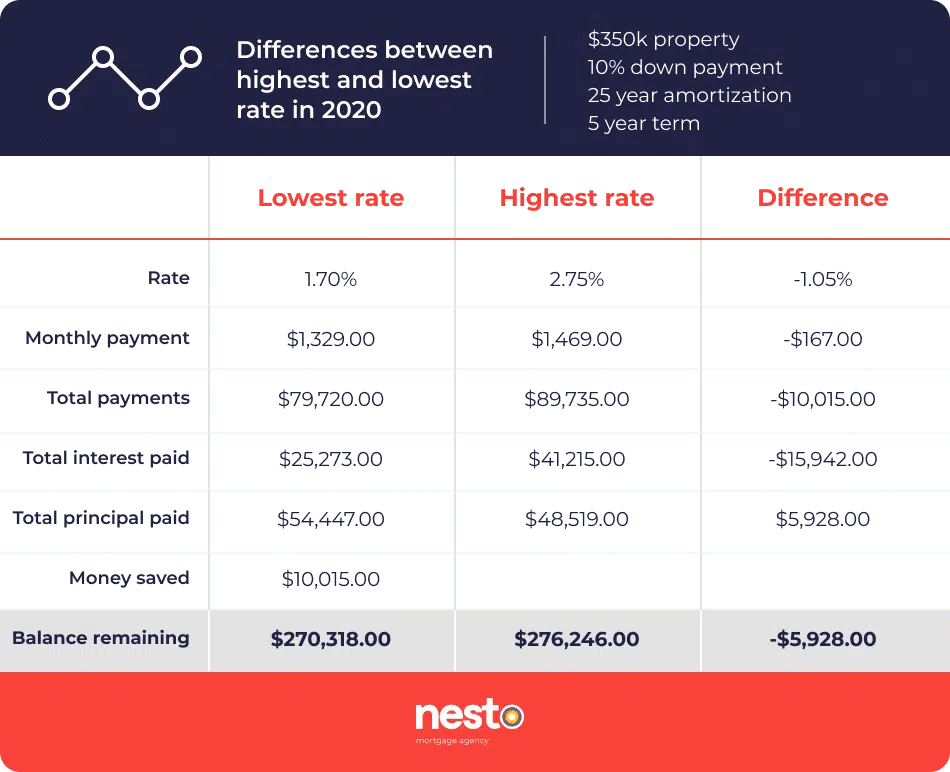
Table 2: Difference in payments, interest, principal and balance of a mortgage over 5 years for rates of 1.70% vs 2.75%. Overall, it represents savings of over $10k, not taking into account the lower remaining balance on the mortgage.
The table above demonstrates the effect of a 1.05% rate difference on a $350,000 purchase with 10% down payment and a 25-year amortization, after a 5-year term. What if you would have waited and bought your house in the last few weeks, at 1.70% – the lowest insured variable rate seen in a long time? Well, you would have saved approximately $10,000 in mortgage payments and also have about $6,000 less owing on the balance in only 5 years compared to those who purchased 7 months prior.
2. TIMING: Where would you stand if you’d taken out a mortgage in January?
a. January vs July fixed rates
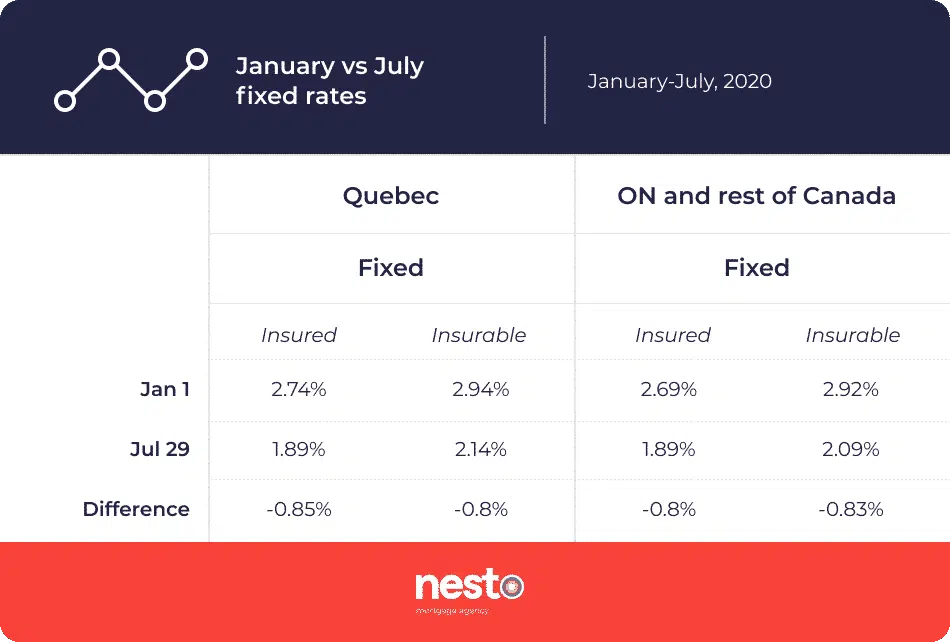
Table 3: Fixed rates in January vs July across provinces. Rates have fallen by -0.8% to -0.85% on nesto’s lowest rates.
Following up on the concept of timing and variance, let’s say you’d taken a fixed-rate mortgage in January 2020. Well, your rate would still be between 0.8-0.85% higher than the best rate you could have had this July.
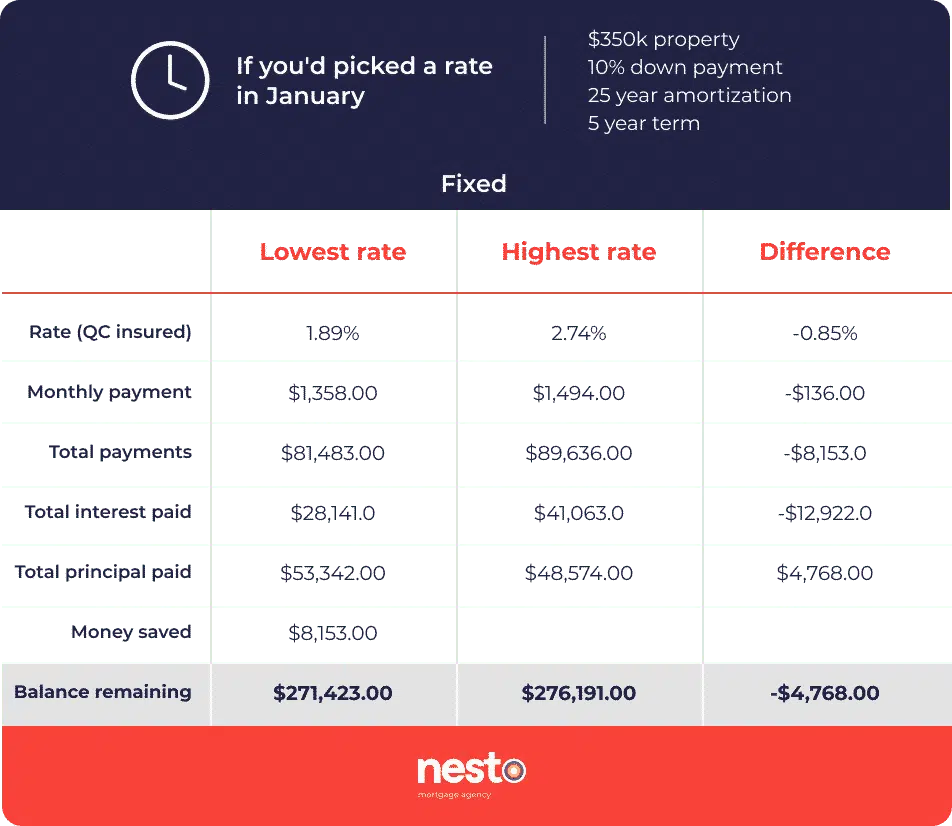
Table 4: Difference in payments, interest, principal and balance of a mortgage over 5 years for rates of 1.89% vs 2.74%, which corresponds to Quebec’s insured fixed rates in July and January respectively. Overall, it represents savings of over $8k, not taking into account the lower remaining balance on the mortgage.
If you look at Table 4, you can actually see, in detail, the effect of that 0,85% rate difference over time (5 years) on a $350,000 purchase with 10% down payment and a 25-year amortization.
b. January vs July variable rates
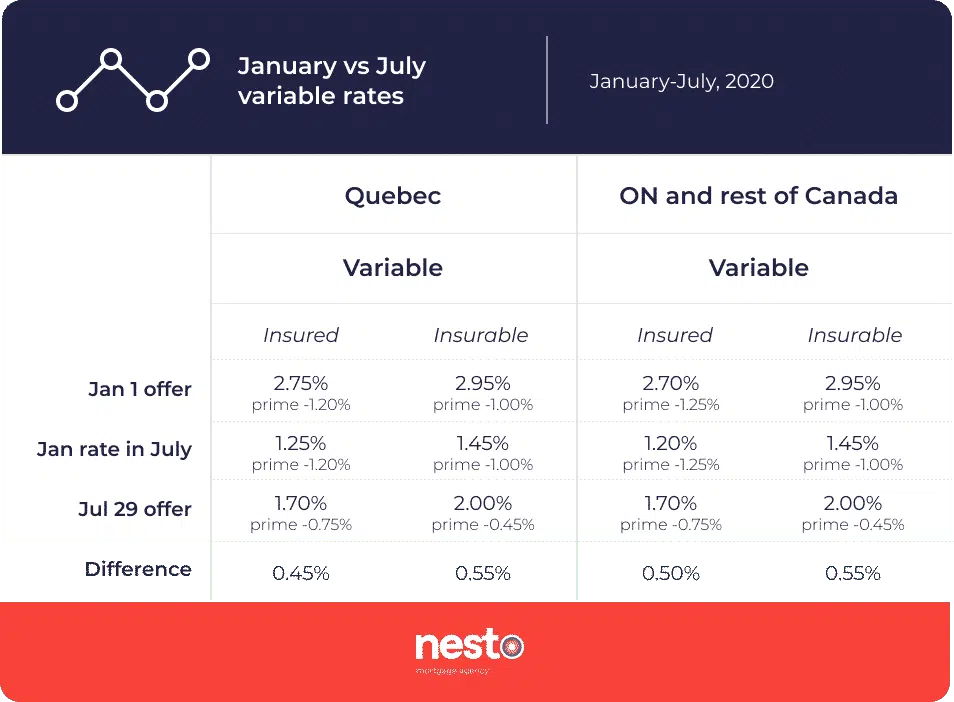
Table 5: Variable rates in January vs July across provinces. Due to variable rates being a discount from the prime rate, though rates are lower than those announced in January, they represent an increase of 0.45% to 0.55%.
Now if we look at the same example, but with variable rates from January to July 2020, the results are completely different.
You see, since variable rates are mainly influenced by the prime rate’s fluctuation, and since prime dropped so much at the peak of the pandemic, lenders are offering smaller discounts right now. Having chosen a variable rate in January, you would still be 0.45-0.55% lower than today’s lowest variable rate.
Table 6 shows what this can represent on a mortgage. In this case, you would have saved over $5,000 in mortgage payments and also have over $3,000 less owing over 5 years by getting your mortgage in January.
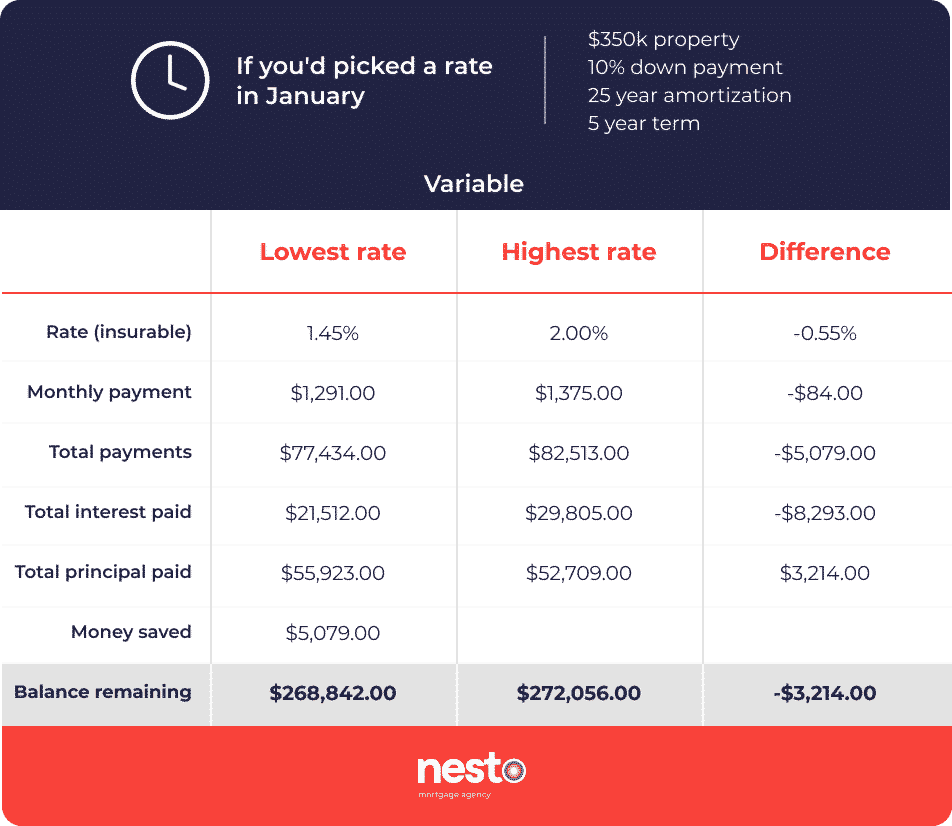
Table 6: Difference in payments, interest, principal and balance of a mortgage over 5 years for rates of 1.45% vs 2.00%, which corresponds to all provinces insurable variable rates in January and July respectively. Overall, it represents savings of over $5k, not taking into account the lower remaining balance on the mortgage.
3. MORTGAGE TYPE TRENDS
a. Purchase vs Renewal
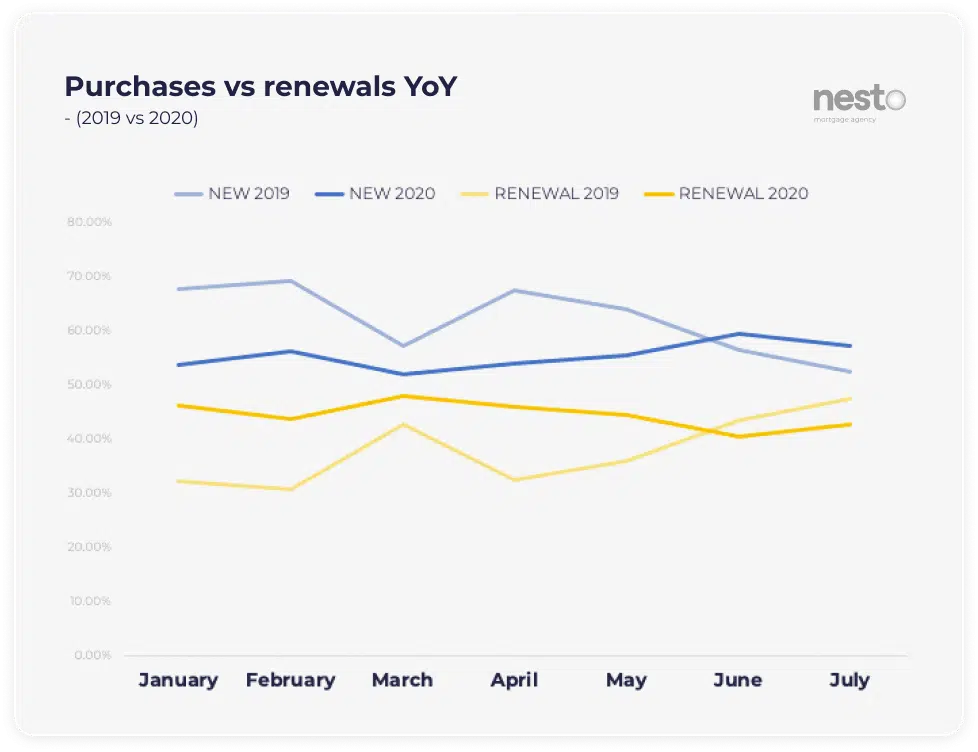
Fig.5: Trends for proportion of purchases (new mortgages) vs renewals from January to July in 2020 vs 2019. Sum is 100% for each month.
Are we seeing more applications from buyers or keepers (mortgage renewers) in 2020? How much did this international crisis affect our homebuying behaviours? Focusing on purchases versus renewals and comparing the data from January to July 2020 versus 2019, we noticed that the proportion of purchases versus renewals was much higher in 2019. Then, as the quarters passed, the gap narrowed to a proportion closer to 50/50 in March 2020.
As far as 2020 and the lockdown goes, we noticed the opposite trend. As purchases were down from February to March, they started slowly moving upward for the following months and throughout COVID-19 lockdown to reach 60% of total purchase and renewal interest volume in June 2020. Buyers are definitely back out in the market.
b. Purchase vs Renewal vs Refinance
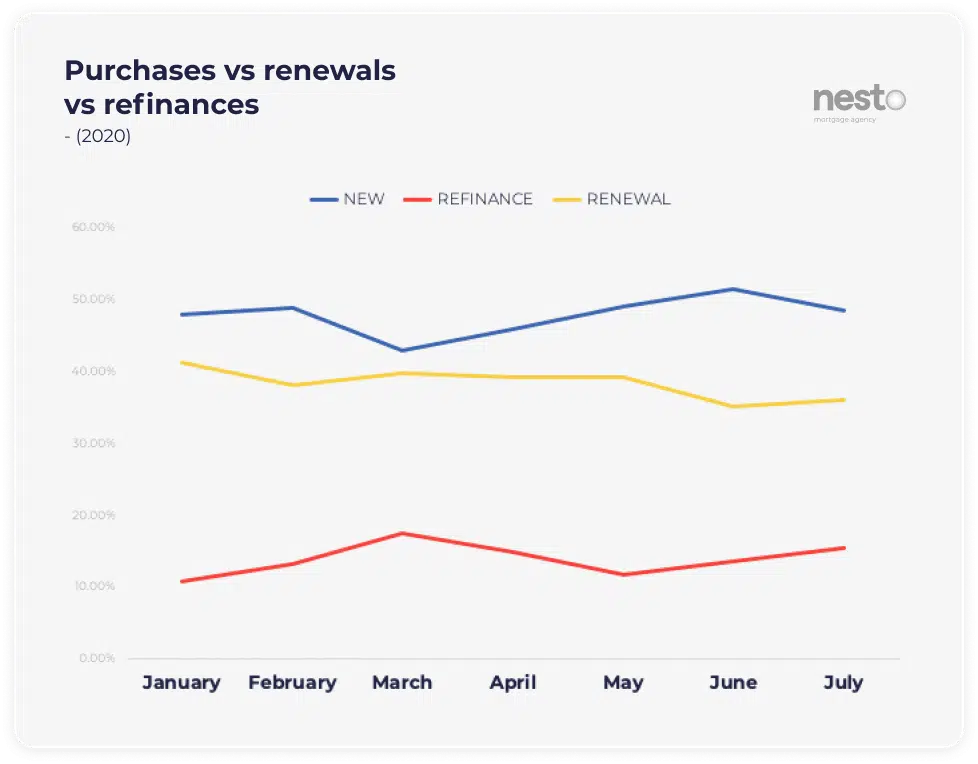
Fig.6: Trends for proportion of purchases (new mortgages) vs renewals vs refinances from January to July 2020. Sum is 100% for each month.
Now, what happens if we add refinances to the mix? Looking only at the data from January to July 2020, we can definitely see a boom of refinance requests starting in March 2020, which matches exactly the beginning of the lockdown period. We could, therefore, assume that more homeowners, while still qualified for refinancing, looked to take some equity out of their homes and/or improve their cash flow positions. As shown in the graph below, through the pandemic, the proportion of refinances slowed down only to pick up again lately, as things became more stable and interest rates hit record lows.
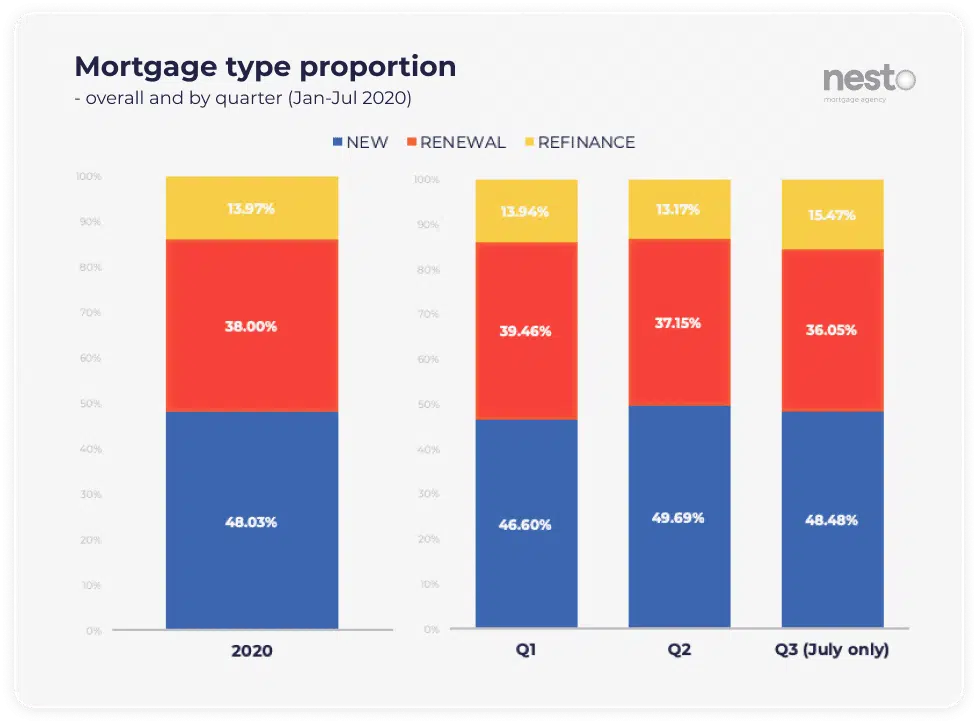
Fig.7: Overall and view by quarter of the proportion of each mortgage type (purchases, renewals and refinances).
Overall, from January to July, purchases represented 48% of nesto.ca user intent, with renewals at 38% and refinances around 14%. The proportions quarter by quarter are similar, with an increase in refinances in the first month of Q3 (July only included so far).
4. PURCHASE PRICE VS DOWN PAYMENT
As a result of the general financial uncertainty, our data shows a decrease in the targeted property value throughout confinement, but a much more pronounced decrease in the planned down payments. Due to 2020’s exclusive situation, the data and analysis for these elements are found in the next section of this report, as it covers the same period.
5. PURCHASE TIMING INTENT
While our data shows an increase in the number of users having signed a purchase offer from January to March 2020, the following months, as a result of the pandemic, show a very different tendency with much more home shoppers (pre-approvals) than active homebuyers (live transactions). See the results detailed below.
Digital Mortgage Shoppers through Lockdown
Borrowers are back in the market, and more cautious than ever
While introducing its very first mortgage financing market report, compiling data obtained through its online application, nesto decided to target a very particular period in time: Borrowers intentions and behaviours pre-, during and post-lockdown in Canada.
Summer 2020 is already half gone, and it feels as if the rollercoaster ride we were forced to hop on last April is finally slowing down its course. Things are gradually getting back to normal, or should we say, some kind of a ‘’new normal’ and, like most industries, the mortgage financing world is climbing back up the slope. But what about the people, the consumers, the borrowers? How did this international health crisis change their life plans? What kind of impact did it have on their general behaviours and intentions towards investment, and most precisely, towards their next property purchase?
Going back to pre-COVID-19, things were actually looking great for 2020. In the first quarter, we saw a 12.8% increase in the number of clients having found a property or with a signed offer, compared to the same period last year. More “ready to buy” and less uncertainty.
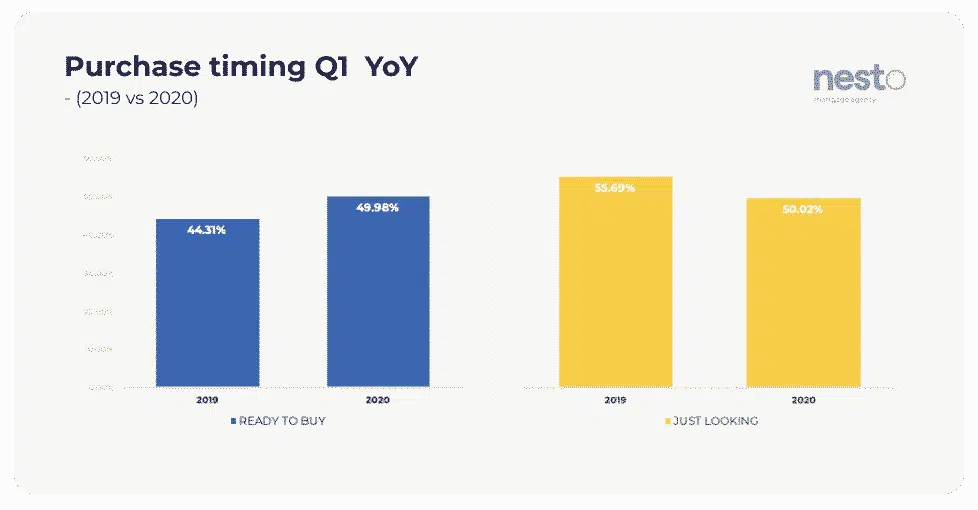
Fig.8: Purchase intent: proportion of users “ready to buy” vs “just looking” in nesto’s mortgage process, comparing Q1 2020 to 2019.
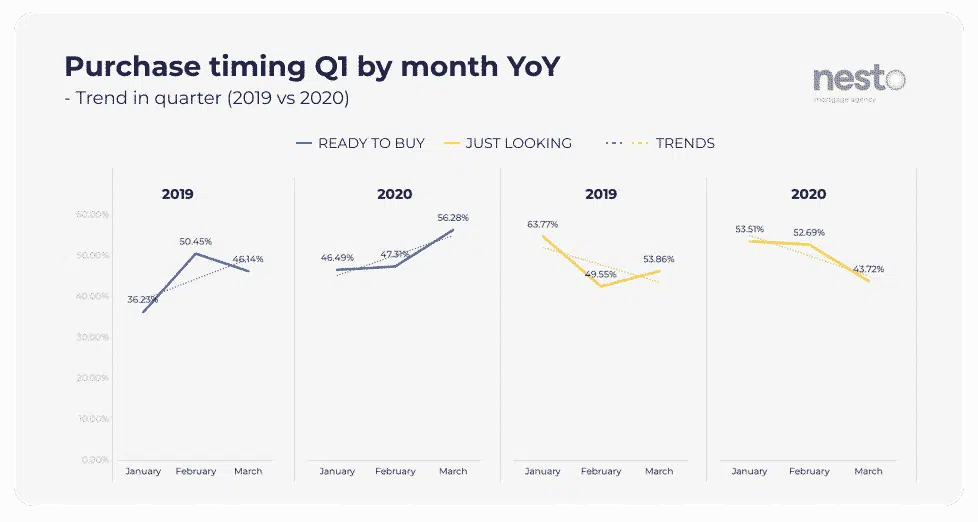
Fig.9: Purchase intent: proportion of users “ready to buy” vs “just looking” in nesto’s mortgage process, showing month by month trends in Q1 2020 vs 2019.
Then, COVID-19 hit, and this proportion of borrowers having found their property dropped significantly – by 33%. The confinement effect was similar across all provinces with our users, with a notable difference in British Columbia, where only 19% of our users were still ready to buy their property in April 2020.
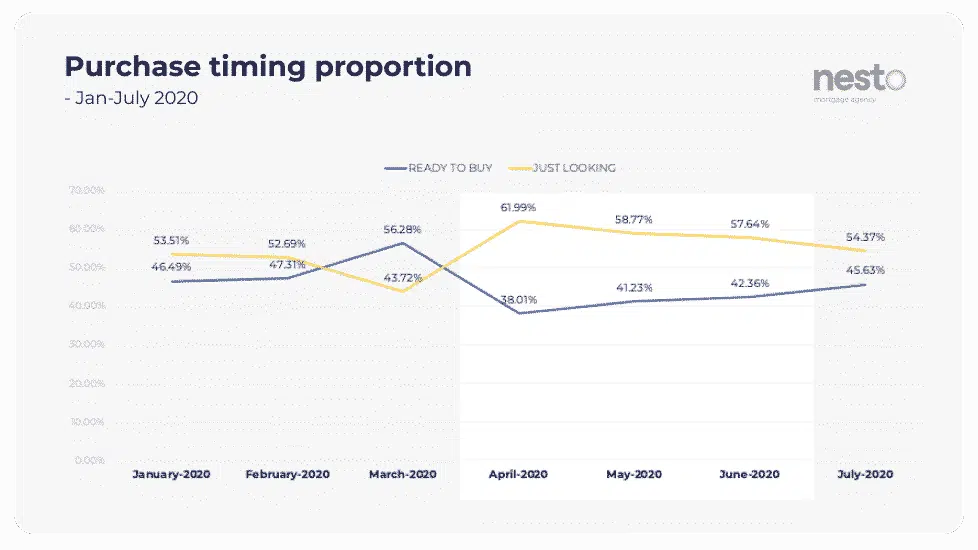
Fig.10: Purchase intent: proportion of users “ready to buy” vs “just looking” in nesto’s mortgage process, from January to July 2020. Highlighted is the confinement period, from end of March to June 2020.
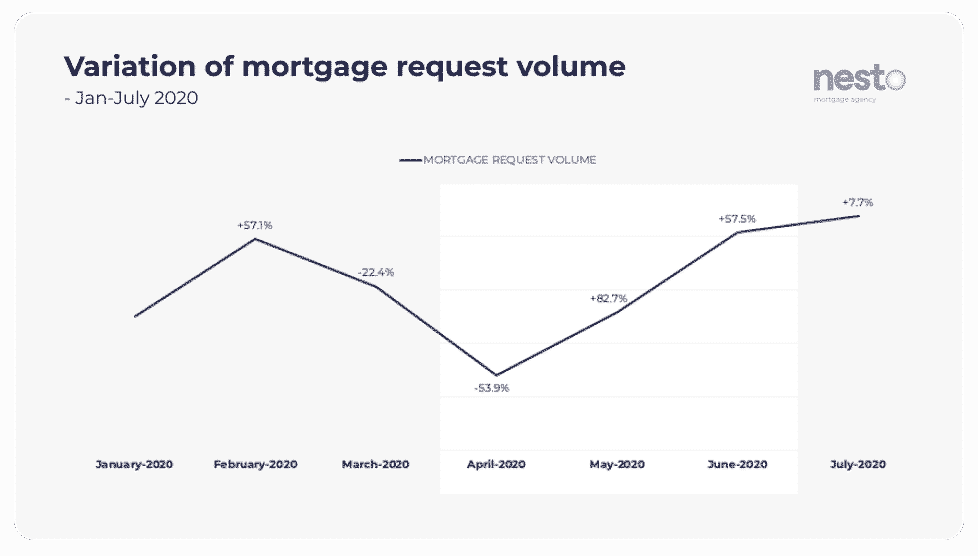
Fig.11: Variation in volume of mortgage requests online at nesto.ca by month from January to July 2020. Highlighted is the confinement period, from end of March to June 2020.
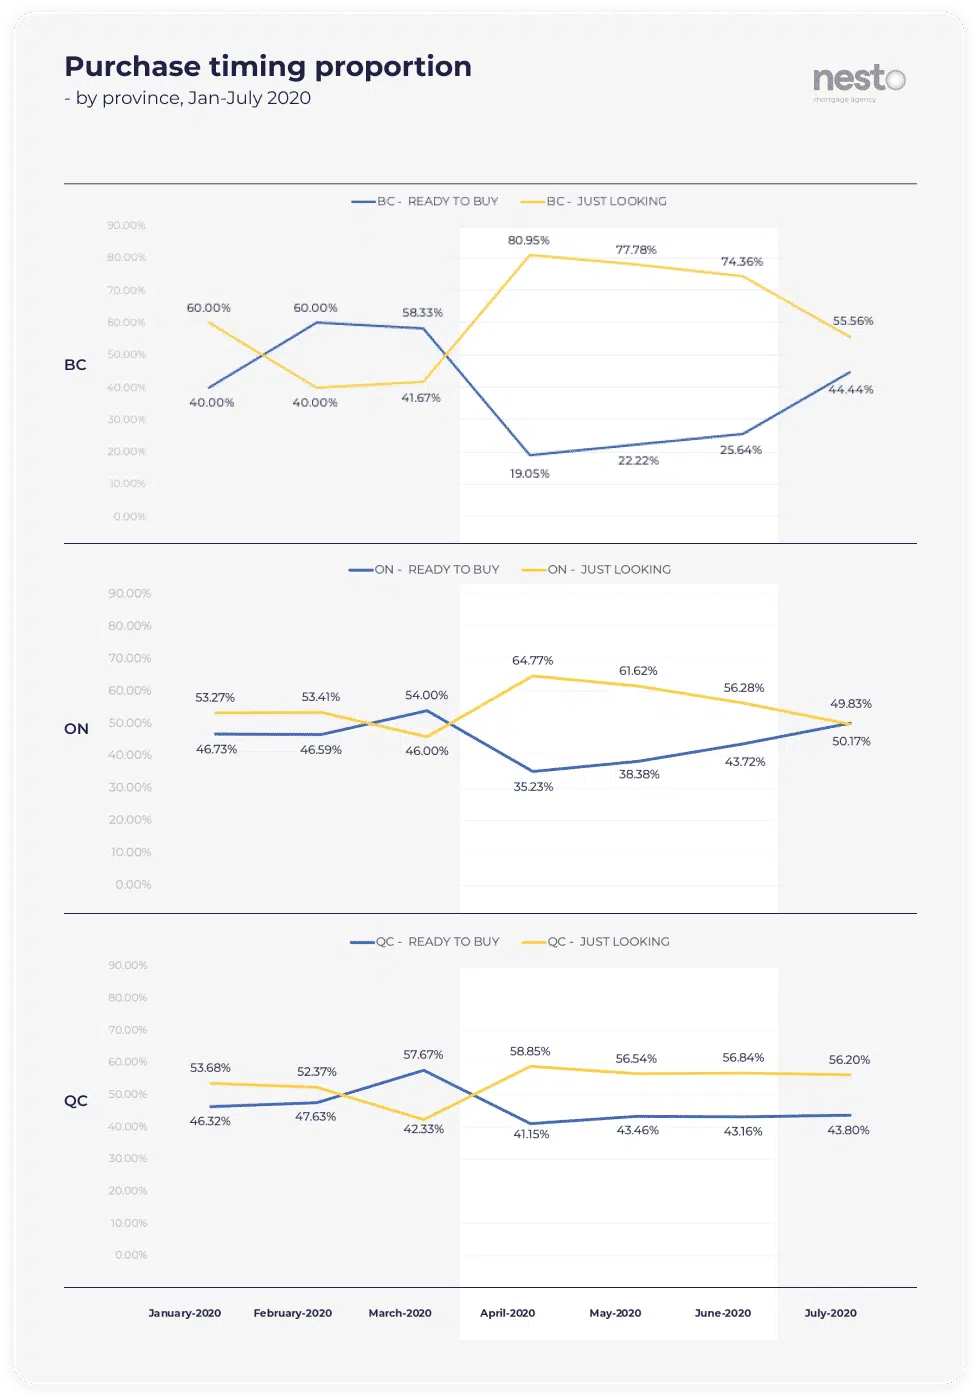
Fig.12: Purchase intent: proportion of users “ready to buy” vs “just looking” in nesto’s mortgage process, from January to July 2020, in British Columbia, Ontario and Quebec. Highlighted is the confinement period, from end of March to June 2020.
As the country started deconfining, in the course of the last few weeks, we saw an increase in mortgage applications, but still, a lot more users in the “just started looking” category than the “ready to buy”. Uncertainty is still very tangible amongst clients and, while still interested in making a purchase, the vast majority is approaching the idea with a lot more cautiousness.
Same goes for the targeted property value and the down payment. While many users had planned on spending a lot more on a house back in March, the market unpredictability made them review their finances, targeting less expensive properties and keeping a lot more money easily accessible for rainy days. From March to April 2020, we saw a 8.4% drop in targeted property value and a huge decrease in planned down payment, from 16% before the pandemic to a 10% average during and post lockdown.
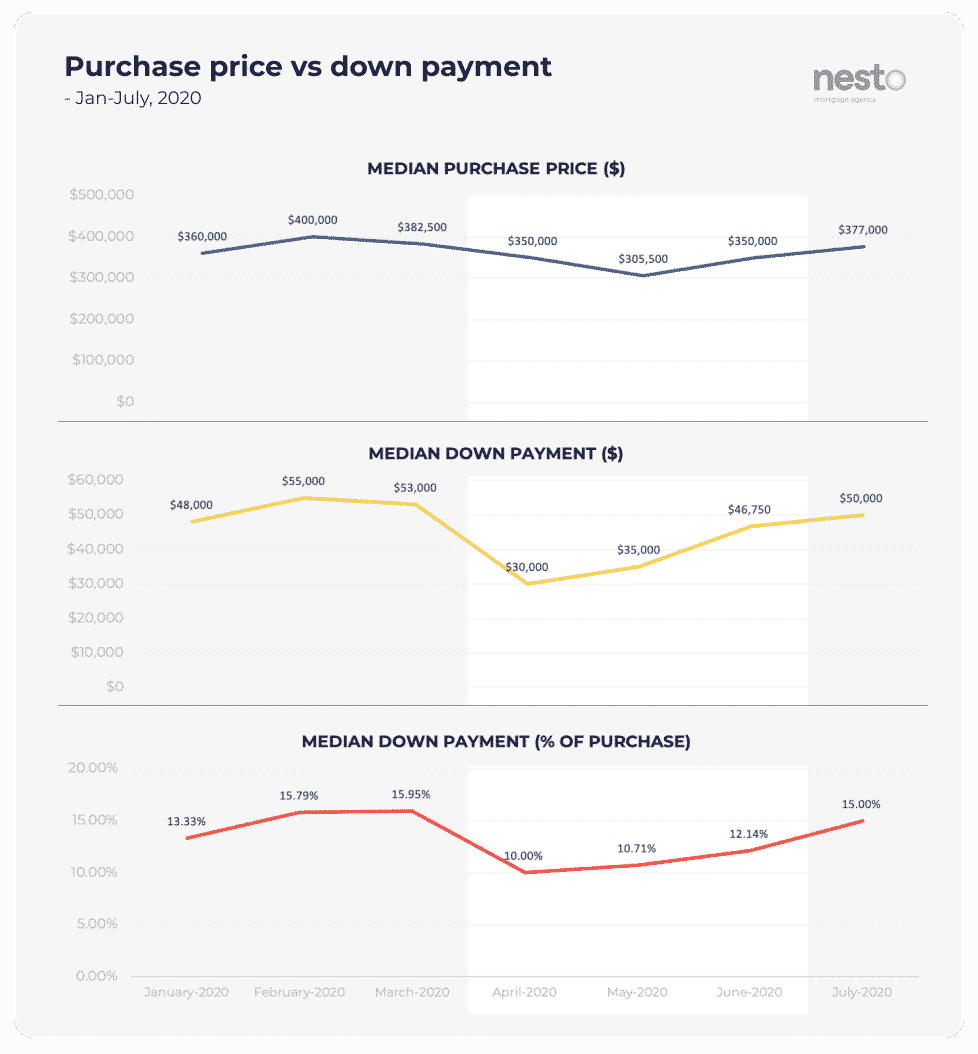
Fig.13: Graph of intended purchase price vs down payment (in dollars and percentage) from January to July 2020. Highlighted is the confinement period, from end of March to June 2020.
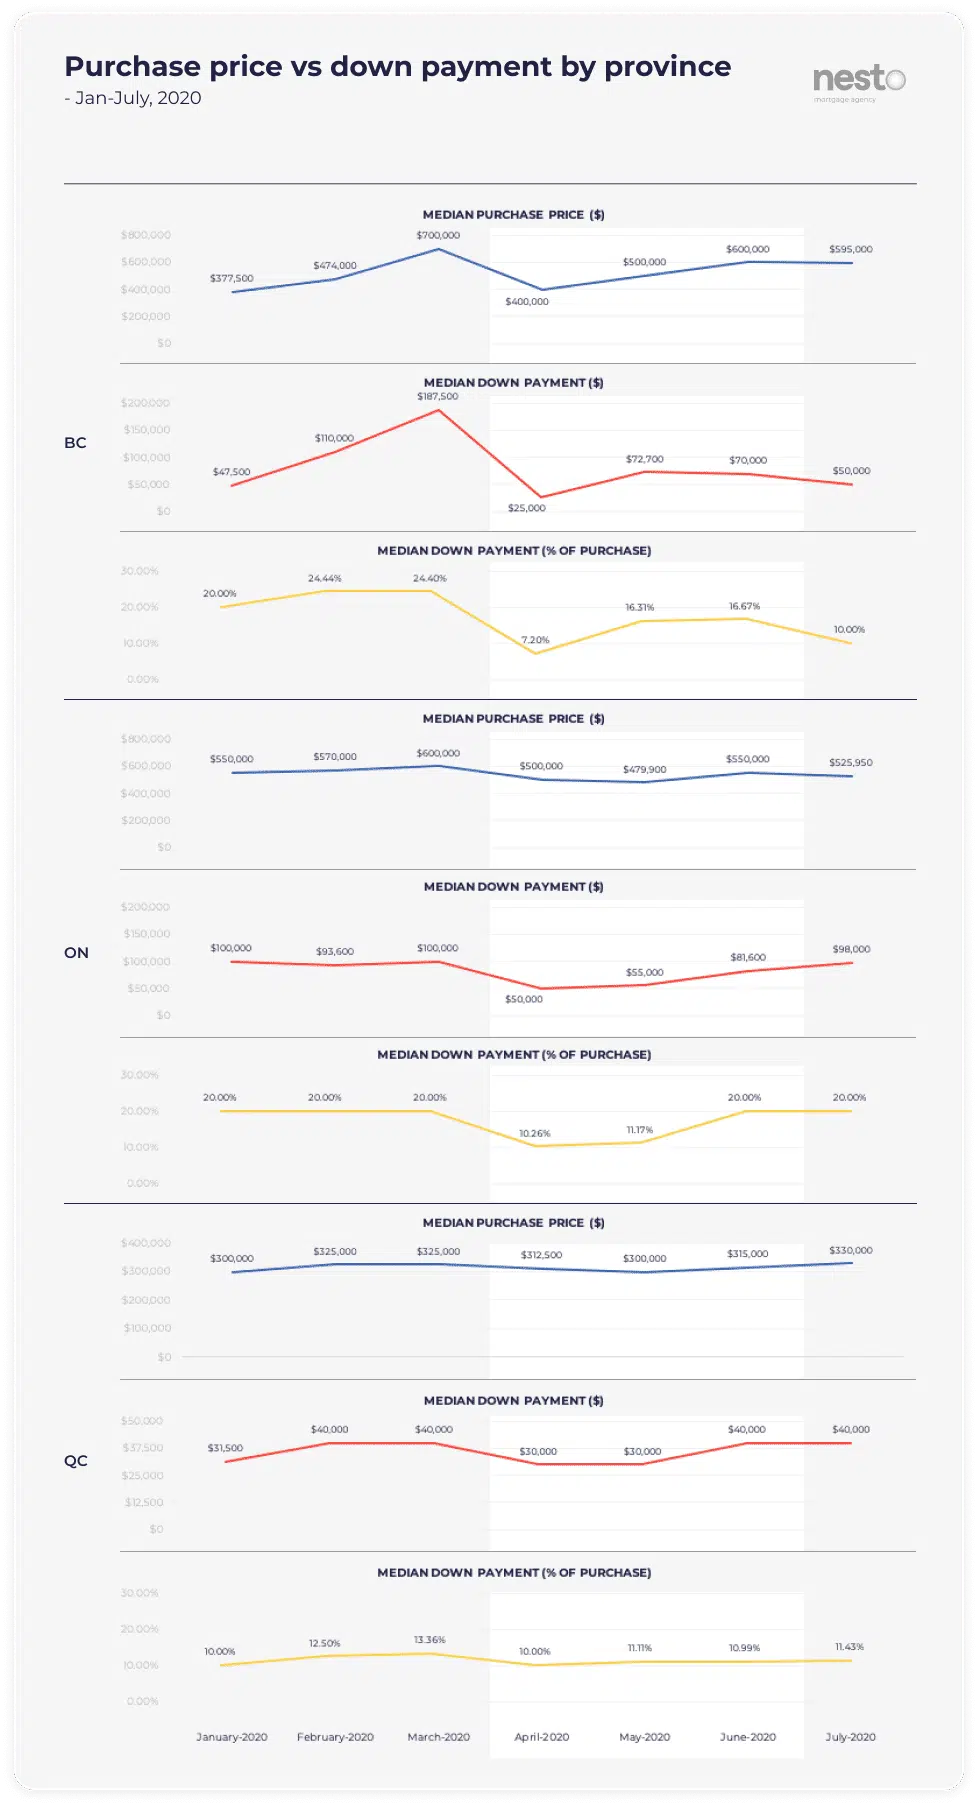
Fig.14: Graph of intended purchase price vs down payment (in dollars and percentage) from January to July 2020 in British Columbia, Ontario and Quebec. Highlighted is the confinement period, from end of March to June 2020.
Users who declared having their revenue impacted by COVID-19 also decided to spend 50% less on their average down payment than those who said they weren’t affected. The same users also aimed for a 9.10% lower targeted property value than those not impacted financially by the pandemic, making it clear that the COVID-19 had prompted them to become more conservative.
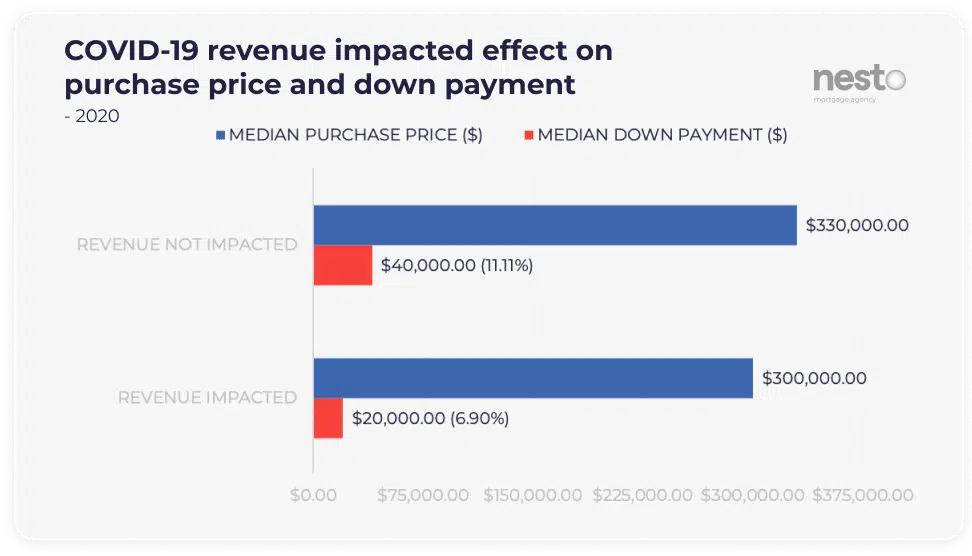
Fig.15: Intended purchase price vs down payment (in dollars and percentage) for users that declared that their revenue wasn’t impacted by COVID-19 vs those that were.
On a slightly more positive note, looking at our data from the last 2 months, both the selected property value and down payment have pretty much gone back to their pre-COVID-19 levels. Despite the fact that a lot of people are still choosing to put less than 10% down payment on their new purchases, those who decide to buy a new property in this recovering economy will benefit from the lowest mortgage rates in a very long time. And that’s extremely good news for both nesto brokers and borrowers!
METHODOLOGY
The data used for this study comes from nesto’s online application and is solely based on the experience of nesto.ca customers/users, not the national market as a whole.
Data is collected from thousands of monthly users declaring their intent or completing online applications across Canada. The data is anonymized and aggregated for analysis.
Data presented within our Rate volatility and variances report refer to nesto’s “best rate” at any given moment. Nesto’s best rate comes from any one of our many lending partners at any given moment.
Want to stay up to date?
Fill in your email info below to receive updates on our reports.
[wpforms id=”3442″ title=”false”]