Bank of Canada Paused the Policy Rate at 2.25%
July 2022 nesto-meter Report

July 13th 2022 – Chase Belair, Co-Founder and Principal Broker at nesto
Welcome to nesto’s monthly mortgage trends and insights report, aka the nesto meter! Each month we’ll report on the state of the housing and mortgage industry. July 2022 mortgage report highlights a rise in renewals and a drop in average down payment amounts. Read on, and learn more!
Key takeaways
- The housing market continues to show signs of cooling down with decreases in median purchase prices with Ontario dropping from $701,000 to $650,000.
- Renewals were at their highest levels in June 2022 (36.11%) since January 2021. Showing that more people want to secure their low rate before more rate hikes happen.
- A significant switch happened in Quebec in June 2022, where users who were ‘just looking’ came in at 53% up almost 10% compared just a month ago. This showing hesitancy as a result of rate increases and affordability.
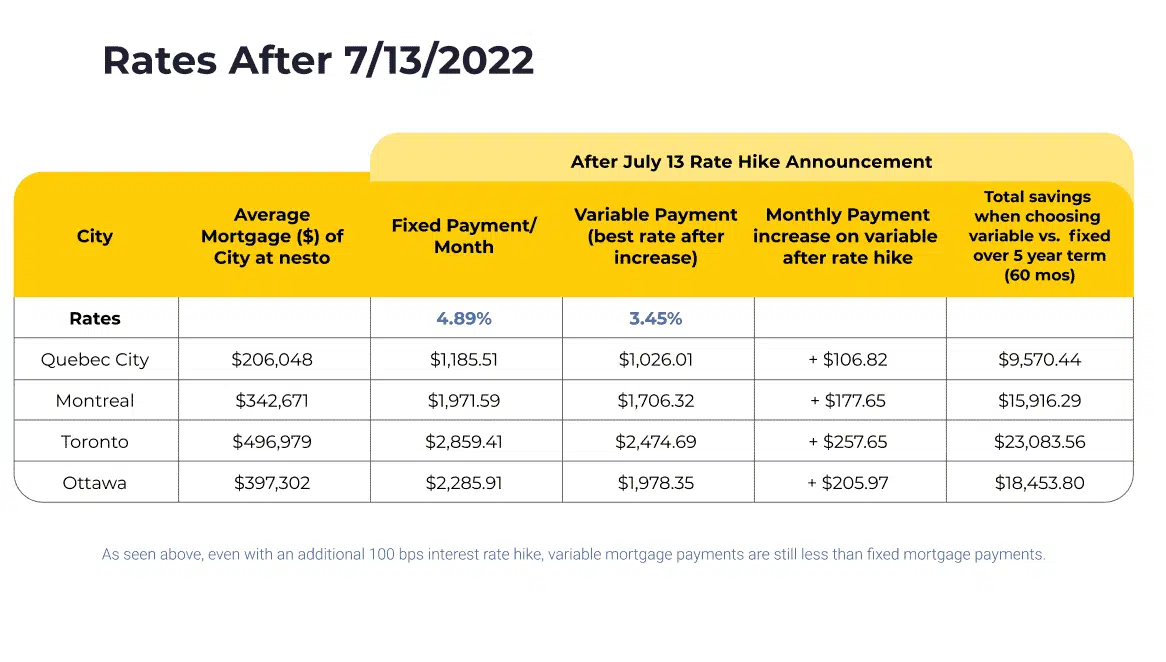
- Even with ongoing rate hikes, we see that variable mortgage payments are still lower than their fixed rate counterparts.
Renewals rise again; Down payments drop
As inflation continues to be an uphill battle, there continues to be increases in the Bank of Canada’s overnight rate in turn. The June 1st announcement brought the overnight rate to 1.5%. Up from 1.0%. Today, July 13th, we saw the overnight rate increase by the most largest number since 1998: 100 bps. Bringing the rate to 2.5%.
These actions lead many potential homebuyers to wonder a) whether there is any impact happening as a result, and b) what home affordability looks like in Canada presently. Alternatively, it is leading current homeowners racing to secure low rates for their mortgage renewals, as seen by the largest peak in renewal apps since January 2021.
Read on to learn about the mortgage industry trajectory and get your answers to these burning questions now.
1. RATES
a. Volatility
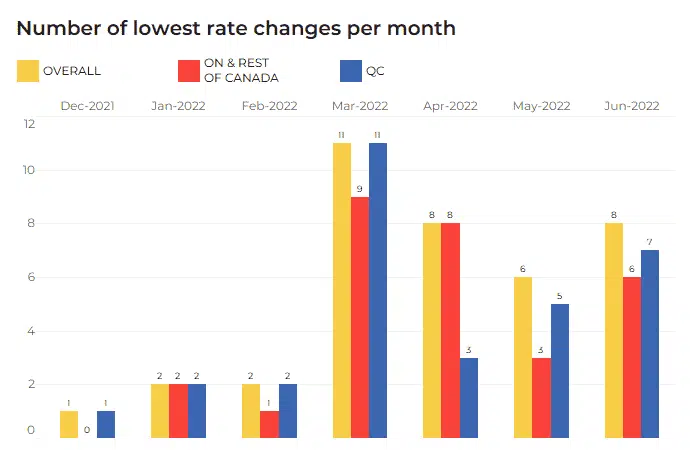
Fig. 1: Number of times the lowest rates offered by nesto to its users changed per month across provinces between December 2021 and June 2022.
Looking at rate changes from December 2021 through June 2022, it becomes clear that the impact of rising prime rates are reflected in the rates offered to users in the nesto database. As seen, prior to the aggressive 0.5% hike announcements that began in March 2022, the average rate changes per month were two; however, now they average between 5 per month.
While June 2022’s average was slightly less than the 8 changes seen in April 2022, our projection is that this will increase yet again following the July 13, 2022 rate announcement.
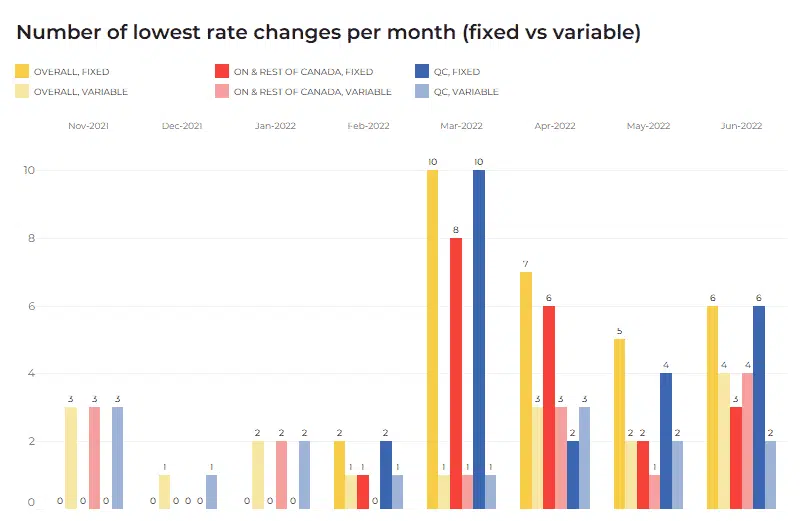
Fig. 2: Number of times the lowest rates offered by nesto to its users changed per month across provinces between November 2021 and June 2022 comparing fixed to variable rates.
Overall, the graphs show what many in the industry already know: Fixed rates are due for continual increases, while variable rates will take a considerably longer time to get to such high levels. Yes, both are going up, but they are not moving at the same speed. For this reason, no matter the province you reside, variable rates are still a great option to keep mortgage payments low.
b. Variance
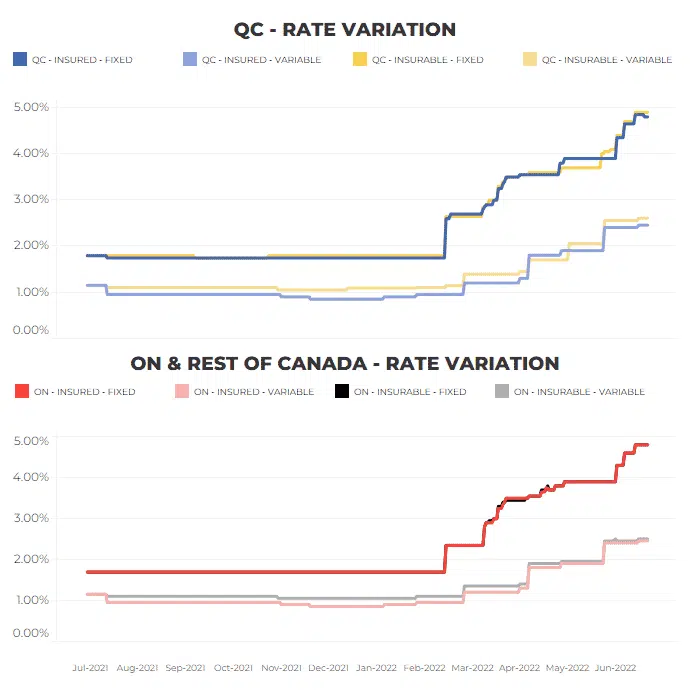
Fig. 3: These graphs show the rate variance in Quebec compared to Ontario and the rest of Canada.
Now let’s talk about variance! Fixed rates continue to rise at a faster pace than variables. This gap widened from March 2022 onwards ( >3% for fixed, and < 3.0% for variable) which is attributed to the interest rate hikes from the Bank of Canada.
Rates are spiking, secure your low rate today to save tomorrow.
With nesto, you can get a low rate with a 150 day hold.
2. MORTGAGE TYPE TRENDS
a. Purchase vs Renewal vs Refinance
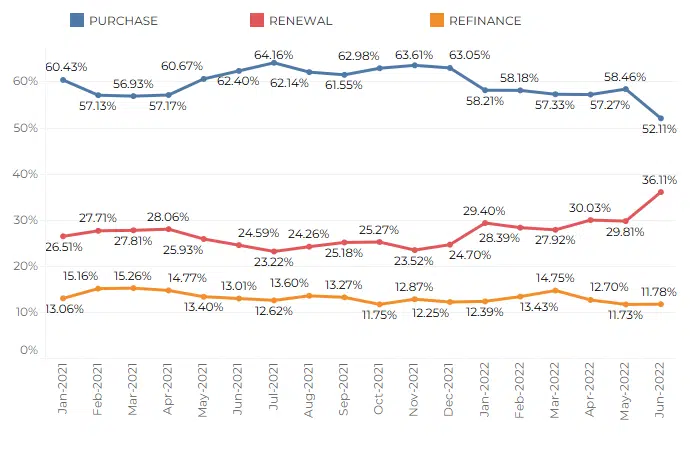
Fig. 4: Trends for proportion of purchases (new mortgages) vs renewals vs refinances from January 2021 to June 2022. We see another jump in renewals May to June 2022.
In our last report, we highlighted that while renewals were still higher than they were at the start of 2022, they did fall slightly in May 2022 (compared to April 2022 among users).
Looking at June 2022, comparatively, we see that renewals again took the lead, and this time, had one of the most major jumps since 2021. Renewals sat at 36.11%, up 6% from their previous documented high in April (30.03%) of this year. This shows that people are realizing now is the time to renew or to lock in their low rate before another rate hike takes hold.
On the new purchases front, looking at June 2022, we notice a drop in new purchases which speaks to the housing market changing. We witnessed the largest decline among new purchases since December 2021, with the number dropping from 58.46% to 52.11%. This speaks to the hesitancy in the new home buyer market and concerns around affordability in light of inflation as well as rate hikes.
3. PURCHASE TIMING INTENT
a. Purchase vs Renewal
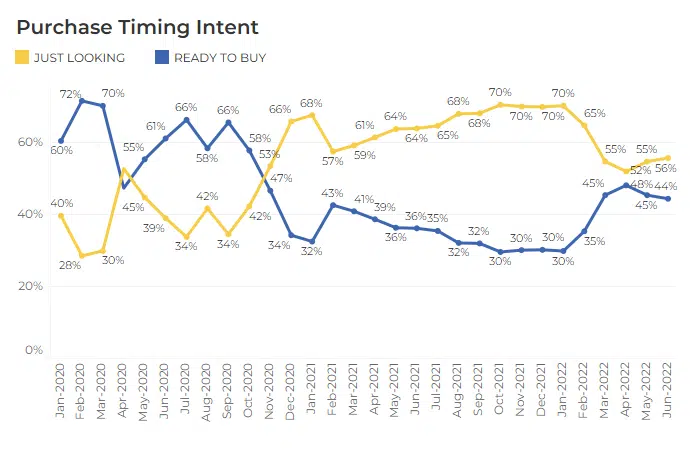
Fig. 5: Purchase intent: proportion of users “ready to buy” vs “just looking” in nesto’s mortgage process, showing month by month from January 2020 through June 2022.
Reported last month, there was an increase of users “just looking”, sitting at 55%, and a decrease of users “ready to buy”, sitting at 45%.
When we look at June 2022, the story around buyer caution is seemingly the same. Since home prices are still relatively high, and mortgage interest rates are at the highest point since pre-pandemic, it makes sense to see that ‘just looking’ continued to have a majority stake at 56% of nesto users, compared to 44% who were ‘ready to buy’.
b. By province
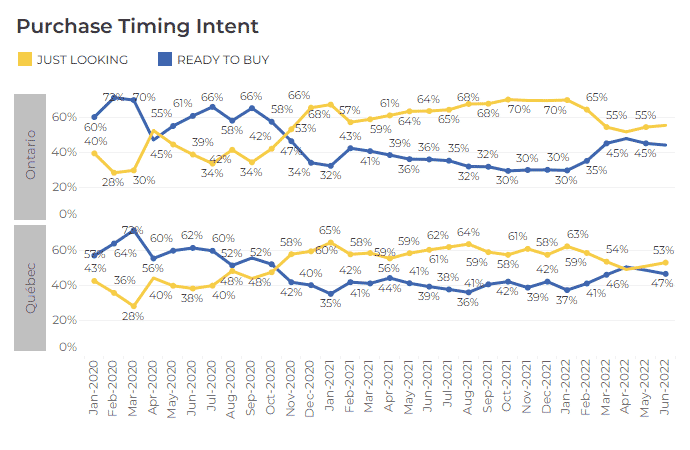
Fig. 6: Purchase timing intent proportion of users “ready to buy” vs “just looking” in nesto’s mortgage process,
from January 2020 through June 2022 in Quebec and Ontario.
In Quebec, ‘ready to buy’ met in the middle with ‘just looking’ in April-May 2022, but given the current climate, it seems that potential buyers have grown more cautious than their Ontario counterparts (who remained at the same levels monthly) and moved towards ‘just looking’ territory.
4. PROPERTY VALUE AND DOWN PAYMENT
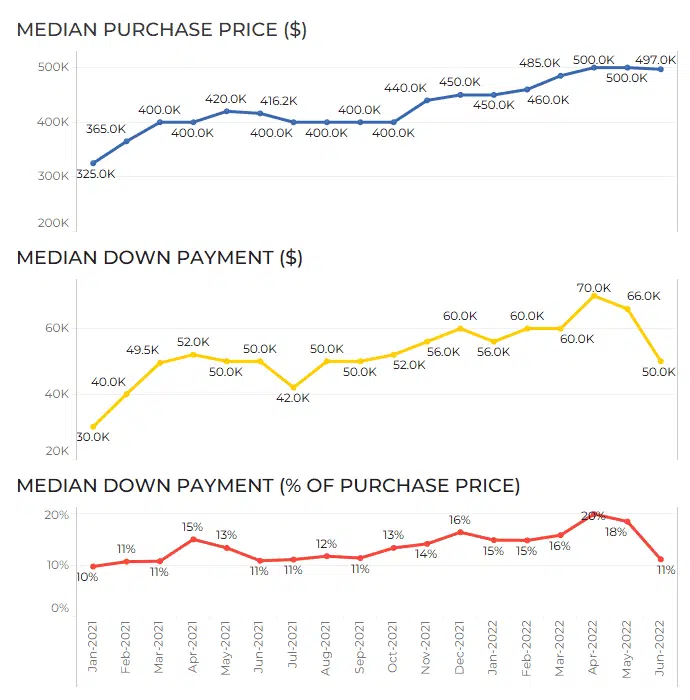
Fig. 7: This chart shows a continuation in the housing market cooling, with down payments dropping by $15,000.
As reported last month, we began seeing early signals of a cooling market. Instead of maintaining an average down payment of $70,000 or increasing further, the number dropped to $65,500.
That market cooling trend has continued, as predicted. We see the median down payment total drop further again from May 2022 to June 2022, now sitting at $50,000. That’s a $15,000 decrease in one month, and a $20,000 difference from the previous high in April 2022 of $70,000. We also see the median purchase price drop to $496,000 from $500,000.
These numbers showcase that the rising interest rates are putting the power back into the home buyer after a few years where sellers held it.
By province
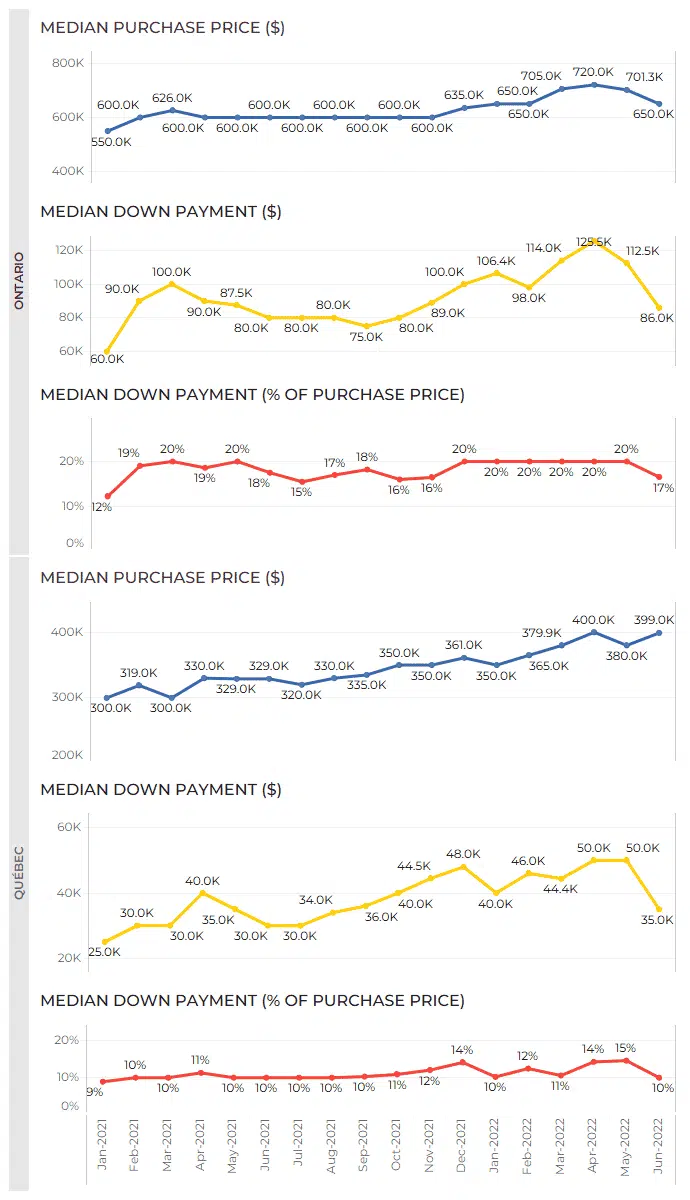
Fig. 8: Graph of intended purchase prices vs down payment (in dollars and percentage) from January 2021
through June 2022 in Ontario and Quebec.
As seen in the charts above, there is a decline happening in both Ontario and Quebec in regards to the average home down payment.
In Ontario, where 20% down payment has usually been the norm, it fell to 16% for the first time since 2021. Additionally, median purchase price took a fall in Ontario, sitting at $650,000, and entering the $600K territory for the first time in 4 months. In Quebec, while the median purchase price increased, it still stayed below the $400,000 high of March 2022 and we see the median down payment drop from 14% to 10%, the lowest since January 2022.
Mortgages giving you a headache?
Take a breather and work with nesto experts to make it easy for you.
5. What is the impact of the rate hike announcements?
Rate hikes undoubtedly shake up the market, and cause higher payments from higher interest rates in their wake. The best way to make sure you’re prepared? Foresight. Below we outline where the rates and payments stand today after the July 13, 2022 Bank of Canada announcement.
The learning here: Secure a low rate today to avoid further impacts later. With nesto’s 150-day rate lock hold, renewers can ensure peace of mind,
METHODOLOGY
The data used for this study comes from nesto’s online application and is solely based on the experience of nesto.ca customers/users, not the national market as a whole.
Data is collected from thousands of monthly users declaring their intent or completing online applications across Canada. The data is anonymized and aggregated for analysis.
Data presented within our Rate volatility and variances report refer to nesto’s “best rate” at any given moment. nesto’s best rate comes from any one of our many lending partners at any given moment.
Author: Chase Belair,
Co-Founder and Principal Broker at nesto
For press and research-related requests,
email us at media@nesto.ca.

Want the full report?
Download below and get it sent directly to your inbox