May 2022 nesto-meter Report
May 18th 2022 – Chase Belair, Co-Founder and Principal Broker at nesto
Welcome to nesto’s monthly mortgage trends and insights report, aka the nesto meter! Each month we’ll report on the state of the housing and mortgage industry. May 2022 mortgage report is centered on the decline of new purchases and the rise of renewals in the face of rate hikes by the Bank of Canada. Read on, and learn more!
Key takeaways
- For the first time in two years, refinances hit an all-time high.
- There was a peak in the number of users leaving big bank lenders to secure a low rate mortgage with nesto at renewal.
- The median home price increased by $50,000 driving the median down payment to 20%, up from 16% in March.
- The average rate changes have nearly tripled with the onset of Bank of Canada rate hikes, causing a decrease in new purchases.
- In spite of rate hikes, at renewal time, most homeowners are opting for a variable rate vs. fixed rate.
From hot to not:
New purchases slow against renewals
Looking closely at our data since the start of 2022 to end of April 2022, it becomes evident that the state of the housing market and economy is heavily impacting homeowners (both current and potential) in various ways.
We noticed that renewals and refinances were up across the board; whereas, new home purchases were down. This shows the impact that the current interest rate hikes are having on the morale of the homebuyers.
While current homeowners are racing to lock in the low interest rates as they stand before another rise, hesitancy stalls new homebuyers from securing a new mortgage.
While Q2 is still in development, the story seems to hold strong for renewers still; yet a dip in both new refinancing and mortgages.
With that said, in this month’s deep dive, we look at two key things:
1) Inflation and its impacts on the housing market.
2) the way interest rate hikes are defining the actions of our users.
Read on and see exactly what the data story is telling.
1. RATES
a. Volatility
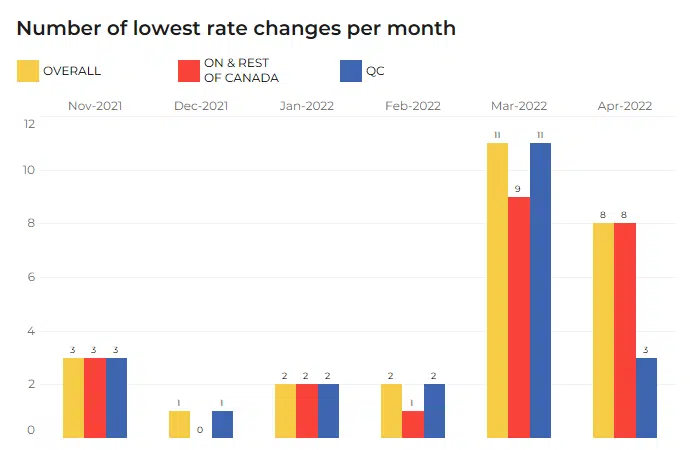
Fig. 1: Number of times the lowest rates offered by nesto to its users changed per month across provinces between November 2021 and April 2022.
Looking at rate changes from November 2021 through April 2022, it becomes clear that the impact of rising prime rates are reflected in the rates offered to users in the nesto database. As seen, prior to the aggressive 0.5% hike announcements that began in March 2022, the average rate changes per month were two; however, now they average between 8-10 per month.
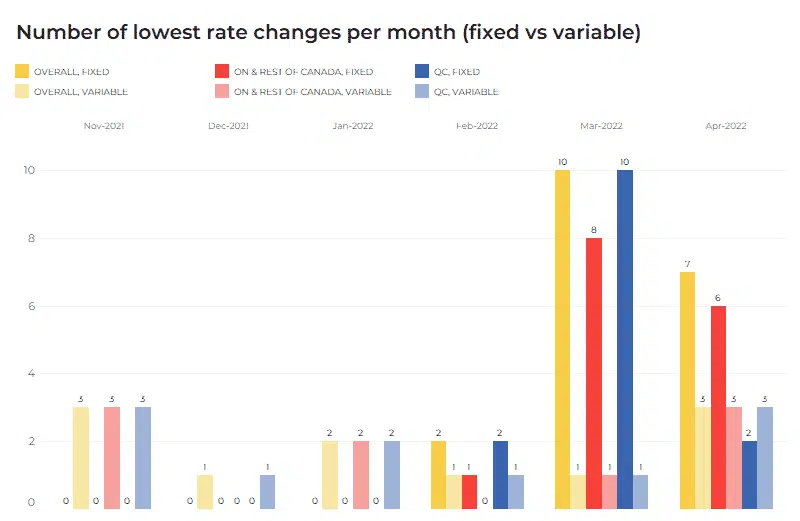
Fig. 2: Number of times the lowest rates offered by nesto to its users changed per month across provinces between November 2021 and April 2022 comparing fixed to variable rates. November 2021 through January 2022 saw no changes to the variable rate.
Overall, the graphs show what many in the industry already know: Fixed rates are due for continual increases, while variable rates will take a considerably longer time to get to such high levels. Yes, both are going up, but they are not moving at the same speed. For this reason, no matter the province you reside, variable rates are still a great option to keep mortgage payments low.
b. Variance
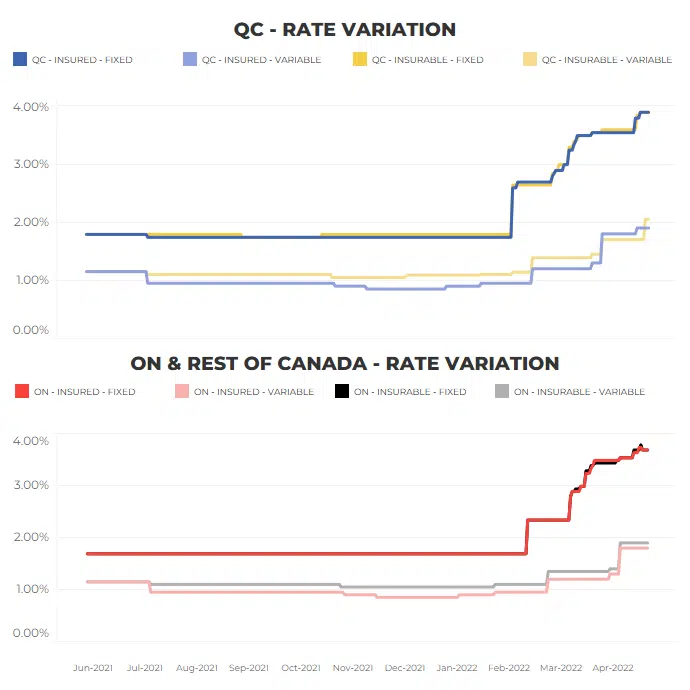
Fig. 3: These graphs show the rate variance in Quebec compared to Ontario and the rest of Canada.
Now let’s talk about variance! Fixed rates continue to raise at a faster pace than variable. This gap widened from February onwards ( >2% for fixed, and 0.95% for variable) which is attributed to the interest rate hikes from the Bank of Canada.
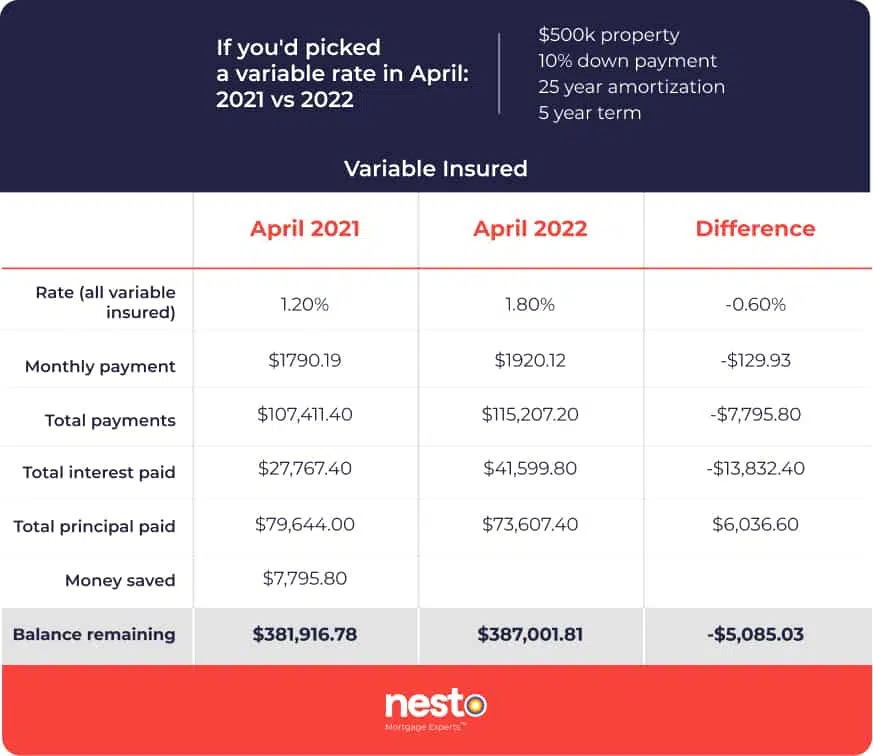
Table 1: This table represents the effect of a 0.60% rate difference on a $500,000 home, with 10% down payment
and a 25-year amortization after a 5-year term.
The table above shows the impact of a 0.60% rate difference on a typical scenario: a $500,000 home, with 10% down payment and a 25-year amortization after a 5-year term. This shows the importance of locking in your rate in advance as interest rate hikes will continue to raise the primary rate.
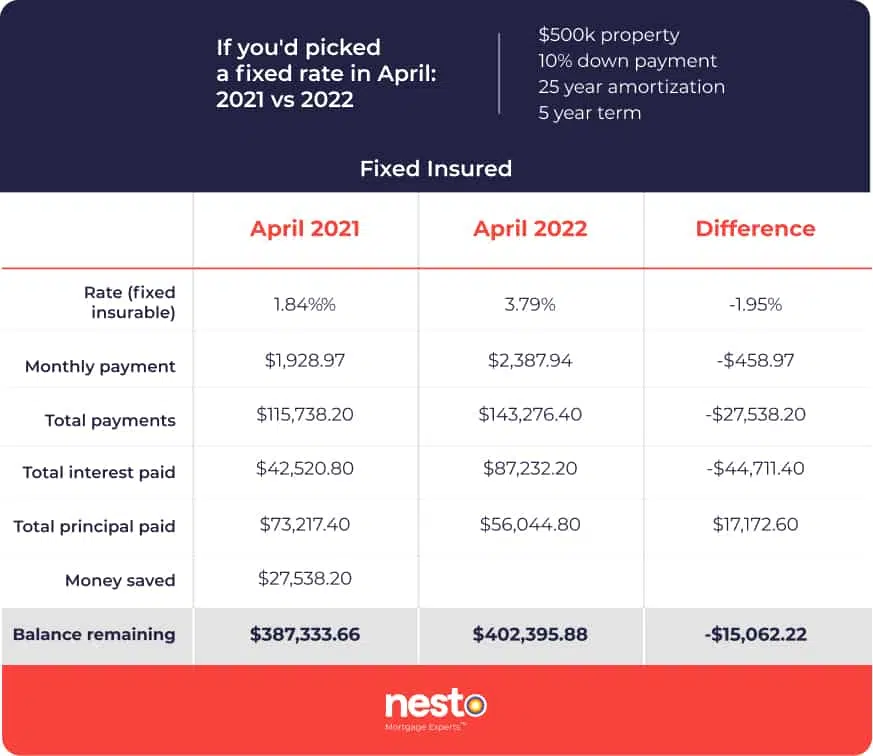
Table 2: This table represents the effect of a 1.95% rate difference on a $500,000 home, with 10% down payment
and a 25-year amortization after a 5-year term.
The table above shows the impact of a 1.95% rate difference on a typical scenario: a $500,000 home, with 10% down payment and a 25-year amortization after a 5-year term. This shows the importance of locking in your rate in advance as interest rate hikes will continue to raise the primary rate.
2. MORTGAGE TYPE TRENDS
a. Purchase vs Renewal vs Refinance
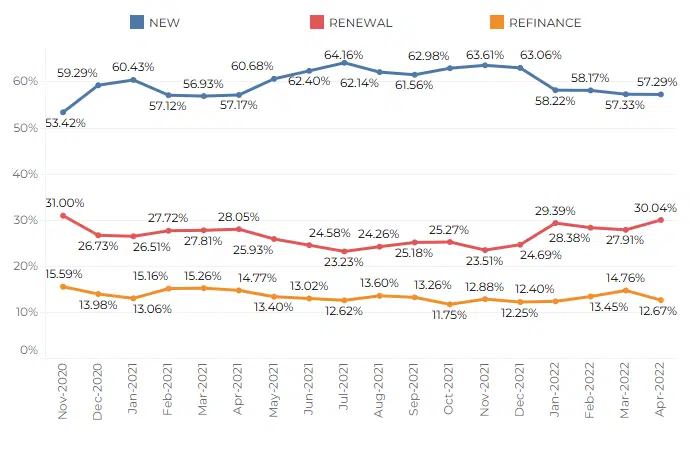
Fig. 4: Trends for proportion of purchases (new mortgages) vs renewals vs refinances from November 2020 to April 2022. We saw a jump in renewals in January and April.
When we look over a two-year period, it’s easy to see that new purchases and renewals had the biggest peaks and dips. Refinances have been relatively predictable with no noticeable changes.
As it stands today, just over 55% of our overall demand coming from users interested in purchasing a new home in comparison to 65% four months prior. Compare this with the current increase in renewals, which is up just above 30%, the highest it’s been in two years. This shows that due to a number of factors, interest hikes and a hot housing market, less people are able to secure a new mortgage and more people are interested in renewing their current mortgage as the future is unknown.
3. PURCHASE TIMING INTENT
a. Purchase vs Renewal
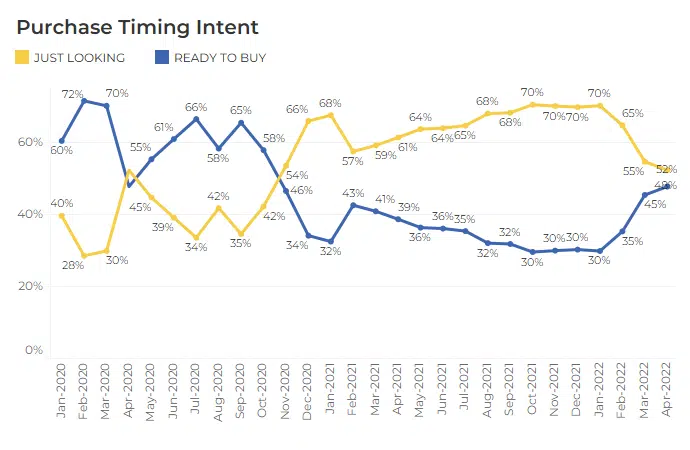
Fig. 5: Purchase intent: proportion of users “ready to buy” vs “just looking” in nesto’s mortgage process, showing
month by month from January 2020 through April 2022.
Through Q1 2022, some pretty noticeable shifts occurred between the “ready to purchase” and “just looking” parties. These two seemingly inverted, and met in the middle in an almost even split.
While 70% of users were “just looking” in December 2021, now only 52% of users are. On the other hand, 30% of those users who were “ready to buy” has now increased to 48%.
This switch is evidently tied to the housing market news. While the news has put fire under those who are “ready to buy”, it has deterred those that are in early stages of the process.
We haven’t seen this split since Fall of 2020, which makes it more impactful and we expect to see the two continue to meet in the middle until the market steadies itself.
b. By province
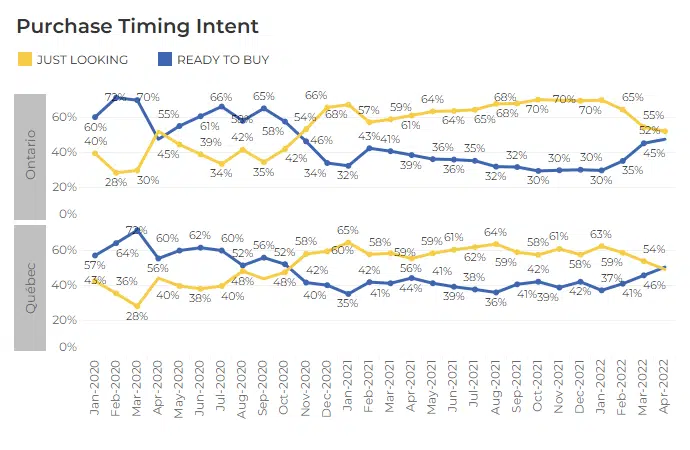
Fig. 6: Purchase timing intent proportion of users “ready to buy” vs “just looking” in nesto’s mortgage process,
from January 2020 through April 2022 in Quebec and Ontario.
4. PROPERTY VALUE AND DOWN PAYMENT
As a result of the general financial uncertainty, our data shows a decrease in the targeted property value throughout confinement, but a much more pronounced decrease in the planned down payments. Due to 2020’s exclusive situation, the data and analysis for these elements are found in the next section of this report, as it covers the same period.
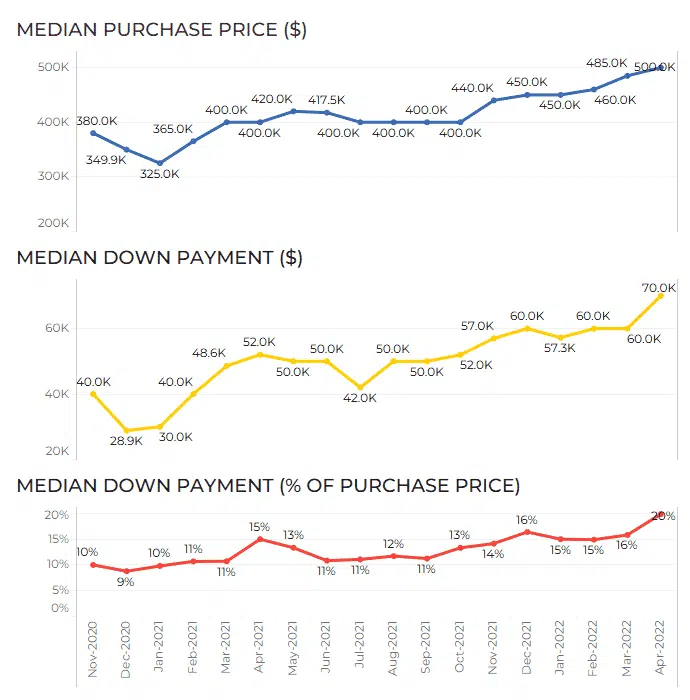
Fig. 7: Graph of intended purchase price vs down payment (in dollars and percentage) from November 2020 to April 2022.
In a nutshell, this sample illustrates that consumers have increased their down payment to match the higher home prices.
The median purchase price has increased from $450,000 (January 2022) to $500,000 (April 2022).
With this median increase of $50,000 on the listing price of a home, the median down payment has reached an all-time high of 20%, a number not seen in over 2 years.
By province
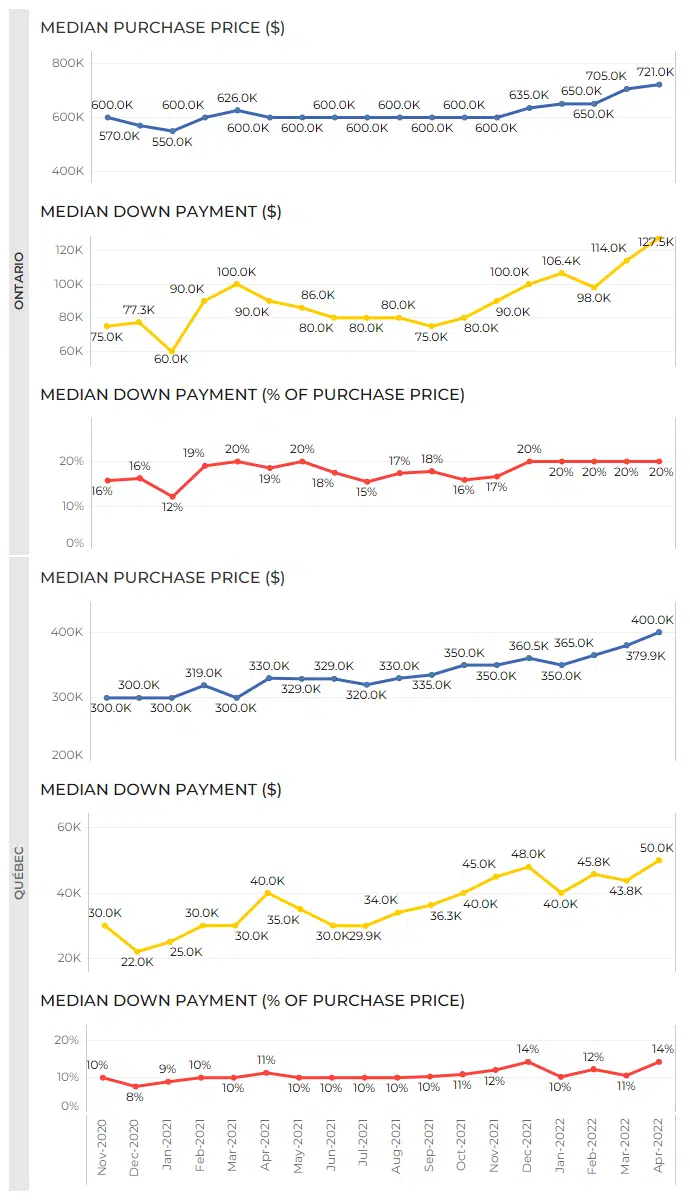
Fig. 8: Graph of intended purchase prices vs down payment (in dollars and percentage) from November 2020
through April 2022 in Ontario and Quebec.
METHODOLOGY
The data used for this study comes from nesto’s online application and is solely based on the experience of nesto.ca customers/users, not the national market as a whole.
Data is collected from thousands of monthly users declaring their intent or completing online applications across Canada. The data is anonymized and aggregated for analysis.
Data presented within our Rate volatility and variances report refer to nesto’s “best rate” at any given moment. nesto’s best rate comes from any one of our many lending partners at any given moment.
Author: Chase Belair,
Co-Founder and Principal Broker at nesto
For press and research-related requests,
email us at media@nesto.ca.
Want to stay up to date?
Fill in your email info below to receive updates on our reports.
[wpforms id=”3442″ title=”false”]


