

Inflation Rate and CPI in Canada Today

The inflation rate is the rate at which the prices of goods and services in the Canadian economy increase over time. Inflation is measured using the Consumer Price Index (CPI), which measures the price movements of a basket of goods and services over time.
The Bank of Canada uses CPI readings to monitor the effects of monetary policy on the economy and adjusts the policy interest rate to bring inflation within the target range. Canada’s inflation rate held at 3.0% in August, matching July, as slower gasoline price growth was offset by higher travel tour and rent prices, while the Bank of Canada’s preferred core measures stayed close to the 2% target.
Key Takeaways
- Canada’s headline CPI held at 3.0% in August 2026 for a second consecutive month.
- Excluding gasoline, inflation rose to 2.4% from 2.2%, so underlying pressure increased even as the headline stood still.
- Grocery price growth fell below headline inflation for the first time since July 2024.
Best Mortgage Rates
Current Inflation Rate in Canada: 3.0%
Inflation rose 3.0% year-over-year in August, matching the 3.0% increase in July, according to Statistics Canada. The headline held steady for a different reason than it climbed a month earlier. Gasoline price growth slowed to 22.8% year-over-year from 25.7% in July, pulling down on the all-items figure, while higher travel tour and rent prices pushed back the other way. On a monthly basis the CPI fell 0.1%, or rose 0.2% once seasonally adjusted.
The composition matters more than the unchanged headline. Excluding gasoline, the CPI rose 2.4% in August after holding at 2.2% for three consecutive months, indicating that underlying price pressures increased while the headline remained unchanged. Excluding energy altogether, inflation ran at 2.3%, and excluding both food and energy it was 2.1%. The energy aggregate itself was still up 15.4% from a year earlier.
The measures of core inflation that the Bank of Canada monitors and uses as the basis for monetary policy decisions were steady in August. CPI-trim held at 1.9% year-over-year for a third consecutive month, CPI-median held at 2.0%, and CPI-common eased to 2.6% from 2.7%. The average of CPI-trim and CPI-median sat at 2.0%, still consistent with underlying price pressures at the Bank’s target even with the headline a full percentage point above it.
Travel drove the offset. Travel tour prices rose 26.1% year-over-year in August, up sharply from 15.2% in July, partly on a base-year effect: Canadian travel to the United States fell steeply in 2025, holding those prices down, and that drag has now dropped out of the 12-month comparison. Newly introduced fuel surcharges added to the increase. On a monthly basis, travel tour prices actually fell 2.9%.
Five of the 8 major components decelerated compared with July. Transportation (+7.5%) still led them all, followed by recreation, education and reading (+5.6%) and food (+2.8%). Shelter (+1.5%) accelerated from 1.3%, and household operations, furnishings and equipment (+0.4%) was again the weakest component. Clothing and footwear slowed to 1.2% from 2.4%, with the clothing sub-index alone down 1.1% year-over-year as men’s clothing fell 2.3% and children’s clothing fell 1.9%.
Inflation by CPI Category, August 2026
| CPI Category | CPI |
|---|---|
| Transportation | 7.5% |
| Recreation, Education and Reading | 5.6% |
| Food | 2.8% |
| Health and Personal Care | 2.2% |
| Alcoholic Beverages, Tobacco Products, and Recreational Cannabis | 1.7% |
| Shelter | 1.5% |
| Clothing and Footwear | 1.2% |
| Household Operations, Furnishings and Equipment | 0.4% |
Inflation Rates by Province, August 2026
| Province | Inflation Rate |
|---|---|
| Nova Scotia | 5.1% |
| New Brunswick | 4.6% |
| Prince Edward Island | 4.4% |
| Manitoba | 4.4% |
| Newfoundland and Labrador | 4.3% |
| Alberta | 3.8% |
| Saskatchewan | 3.5% |
| Quebec | 3.1% |
| British Columbia | 3.0% |
| Ontario | 2.4% |
Fuel oil sits behind the Atlantic Canada figures. Prices for fuel oil and other fuels rose 43.7% year-over-year in August, up from 29.5% in July, and fuel oil is more commonly used for home heating in that region than anywhere else in the country. Nova Scotia at 5.1% and New Brunswick at 4.6% are carrying a heating-cost shock that a national average conceals. Ontario, at 2.4%, remains the only province below the national figure other than British Columbia, which matched it exactly at 3.0%.
Grocery Inflation Falls Below the Headline Rate
Prices for food purchased from stores rose 2.8% year-over-year in August, down from 3.1% in July. That crossed a line worth marking: for the first time since July 2024, grocery price growth ran slower than the all-items CPI. Groceries had outpaced headline inflation for 18 consecutive months through July.
Dairy led the deceleration. Dairy product prices rose just 0.7% year-over-year in August after a 3.1% increase in July, with cheese and yogurt the largest contributors to the slowdown. Smaller increases for fresh or frozen pork (+1.6%), condiments, spices and vinegars (+0.7%) and fresh fruit (+4.7%) added to it.
A slower rate of increase is not the same as relief at the till. Grocery prices are 29.0% higher than they were in August 2021. Inflation measures the pace of change, not the level, so a household comparing a receipt to one from 5 years ago is looking at a cumulative increase that no single month of deceleration can reverse.
Shelter Costs Tick Up as Rent Growth Accelerates
Shelter cost growth rose to 1.5% year-over-year in August from 1.3% in July, ending a run of easing that had taken it to its slowest pace since May 2020. Shelter inflation has still run below 2% throughout 2026 as the Canadian housing market stayed soft, but the direction has turned.
Rent is the reason. Rent prices rose 2.8% year-over-year in August, up from 2.5% in July, with Manitoba (+4.3%) and Ontario (+2.4%) driving the acceleration. Shelter carries the largest weight of the 8 CPI components, so a turn in rent moves the headline rate more than a comparable move in any other category.
Asking rents point the other way, and the two measures are not in conflict. The average asking rent for all property types was $2,037 in July, down 4.0% year-over-year and a 22nd consecutive month of annual decline, according to the Rentals.ca and Urbanation National Rent Report. Asking rents track what a landlord lists a vacant unit for, while the CPI rent component tracks what tenants across the existing stock actually pay, including renewals in rent-controlled units catching up to earlier market increases. New leases can get cheaper while the average rent paid still rises.
For a household deciding between renting and buying, that distinction is the practical one to make. A falling asking rent is available only if you move. The rent you already pay is more likely to follow the CPI series, and in August that series accelerated.
What Is Inflation and How Is It Measured
Inflation measures the increase in the cost of goods and services over time. Inflation reduces purchasing power over time, and as inflation increases, your dollar no longer goes as far as it used to.
Inflation is measured using the Consumer Price Index (CPI), which tracks price changes by comparing the retail prices of a basket of goods and services over time. CPI is divided into 8 major categories, each weighted and assigned a share based on the importance of the good or service to consumer spending habits. Basket weights are typically updated annually.
CPI Basket Weights
| Category | CPI Basket Weight |
|---|---|
| Shelter | 28.30% |
| Transportation | 18.54% |
| Food | 16.93% |
| Household Operations, Furnishings and Equipment | 12.80% |
| Recreation, Education and Reading | 9.81% |
| Health and Personal Care | 5.40% |
| Clothing and Footwear | 4.50% |
| Alcoholic Beverages, Tobacco Products and Recreational Cannabis | 3.73% |
CPI is calculated based on the percentage change over a 12-month period and is a key indicator of inflationary pressures in the Canadian economy. CPI data are measured in each province and territory and weighted by the importance of that province to consumer spending in Canada.
CPI Basket Weights by Province
| Geography | Weight |
|---|---|
| Canada | 100% |
| Newfoundland and Labrador | 1.32% |
| Prince Edward Island | 0.36% |
| Nova Scotia | 2.50% |
| New Brunswick | 1.92% |
| Quebec | 20.74% |
| Ontario | 39.76% |
| Manitoba | 3.18% |
| Saskatchewan | 2.85% |
| Alberta | 12.56% |
| British Columbia | 14.63% |
| Whitehorse, Yukon | 0.08% |
| Yellowknife, Northwest Territories | 0.07% |
| Iqaluit, Nunavut | 0.03% |
The Bank of Canada’s Preferred Measures of Core Inflation
The Bank of Canada monitors 3 measures of core inflation and uses these readings as the basis for monetary policy decisions.
CPI-trim
This measurement excludes CPI components with extreme price movements in a given month. This measure reduces the impact of volatile changes caused by conditions that affect only a specific component. For example, an extreme drought affecting crop prices could artificially inflate the food component in a given month. CPI-trim removes 40% of the total CPI basket, calculated by removing the highest and lowest 20% of weighted monthly price variations. CPI-trim was 1.9% in August 2026.
CPI-median
This measurement also filters out volatile price movements in components, similar to the CPI trim. However, this measurement uses the middle point, or median, price change within the range for a component. CPI-median was 2.0% in August 2026.
CPI-common
This measurement follows price changes that are common across basket categories. A statistical model known as the factor model identifies common variations, filtering out price movements specific to a component. CPI-common was 2.6% in August 2026.
Where Is the Bank of Canada’s Policy Rate Headed Next?
The Bank of Canada held its policy rate at 2.25% on September 2, 2026, its seventh consecutive hold, as all 35 economists in a late-August Reuters poll had expected. The Governing Council said the economy and inflation had evolved broadly as projected in July, while flagging that upside risks to inflation have increased and that new tariffs make growth prospects more uncertain. It gave no guidance on its next move.
The August CPI report gives the Bank little reason to change course. Core measures held where the Bank wants them, with CPI-trim at 1.9% and CPI-median at 2.0%, and the headline stayed put rather than climbing further above target. The detail that complicates the picture is inflation excluding gasoline rising to 2.4%, since the Bank has been treating the headline overshoot as an energy story that would fade. An energy shock becoming broader is precisely the risk it named in September.
Market pricing has moved ahead of the economists. Money markets are pricing a partial increase for the December 9 decision, while most bank economists still see the policy rate frozen at 2.25% through 2026, with the first increase arriving in 2027. That gap matters more to fixed mortgage rates than the September hold itself, because Government of Canada bond yields follow what markets price rather than what forecasts say. The next rate announcement is October 28, 2026, alongside the Bank’s next full Monetary Policy Report.
For a full breakdown of the September decision, see our Bank of Canada Announcement article, and for a longer-range view, our Mortgage Rates Forecast.
On September 2, the Bank of Canada held its target for the overnight rate at 2.25% for its seventh consecutive decision, leaving the prime rate unchanged at 4.45%. The recovery has broadened since the spring, with second-quarter growth of an annualised 3.3% ahead of the Bank’s own 2.5% projection, but the labour market has cooled further: employment fell 68,000 in September, and the unemployment rate rose to 6.5%. Inflation held at 3% in August, kept there by gasoline, while core measures stayed near target, and the Bank still expects inflation to return to 2% by early 2027. Governor Tiff Macklem was direct about where the balance now sits:
Unlike in July, the Bank framed this decision around two risks pulling in opposite directions: persistently high oil prices that could spill over into other prices, and new US tariffs that make growth less certain. It offered no forward guidance beyond a readiness to move if conditions change. Bond markets put the odds of a 25-basis-point hike on October 28 at 26%, against 74% for a hold, and imply 89% for a hike by December 9. Read the full Opening Statement and our post-announcement mortgage strategy breakdown to understand what this means for Canada’s mortgage rate forecast.
Historical Inflation Rates in Canada
The table below presents a 10-year historical overview of Canadian inflation rates from January 2016 to the present.
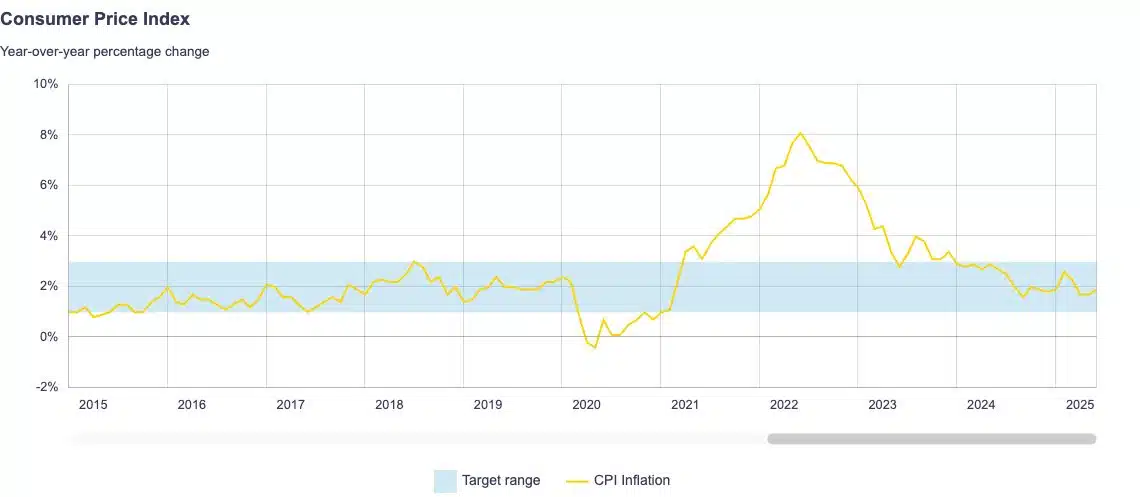
Source: Bank of Canada
| Year | Jan | Feb | Mar | Apr | May | Jun | Jul | Aug | Sep | Oct | Nov | Dec |
|---|---|---|---|---|---|---|---|---|---|---|---|---|
| 2016 | 2.0% | 1.4% | 1.3% | 1.7% | 1.5% | 1.5% | 1.3% | 1.1% | 1.3% | 1.5% | 1.2% | 1.5% |
| 2017 | 2.1% | 2.0% | 1.6% | 1.6% | 1.3% | 1.0% | 1.2% | 1.4% | 1.6% | 1.4% | 2.1% | 1.9% |
| 2018 | 1.7% | 2.2% | 2.3% | 2.2% | 2.2% | 2.5% | 3.0% | 2.8% | 2.2% | 2.4% | 1.7% | 2.0% |
| 2019 | 1.4% | 1.5% | 1.9% | 2.0% | 2.4% | 2.0% | 2.0% | 1.9% | 1.9% | 1.9% | 2.2% | 2.2% |
| 2020 | 2.4% | 2.2% | 0.9% | -0.2% | -0.4% | 0.7% | 0.1% | 0.1% | 0.5% | 0.7% | 1.0% | 0.7% |
| 2021 | 1.0% | 1.1% | 2.2% | 3.4% | 3.6% | 3.1% | 3.7% | 4.1% | 4.4% | 4.7% | 4.7% | 4.8% |
| 2022 | 5.1% | 5.7% | 6.7% | 6.8% | 7.7% | 8.1% | 7.6% | 7.0% | 6.9% | 6.9% | 6.8% | 6.3% |
| 2023 | 5.9% | 5.2% | 4.3% | 4.4% | 3.4% | 2.8% | 3.3% | 4.0% | 3.8% | 3.1% | 3.1% | 3.4% |
| 2024 | 2.9% | 2.8% | 2.9% | 2.7% | 2.9% | 2.7% | 2.5% | 2.0% | 1.6% | 2.0% | 1.9% | 1.8% |
| 2025 | 1.9% | 2.6% | 2.3% | 1.7% | 1.7% | 1.9% | 1.7% | 1.9% | 2.4% | 2.2% | 2.2% | 2.4% |
| 2026 | 2.3% | 1.8% | 2.4% | 2.8% | 3.2% | 2.8% | 3.0% | 3.0% |
What Drives Inflation?
Supply and demand in the economy are typically the key drivers of inflation. Demand for products or services can sometimes exceed the available supply. When this happens, prices are increased to close the gap. This is known as demand-pull inflation, which occurred recently in the economy when businesses laid off employees during the pandemic and then struggled with labour shortages, leaving them unable to meet increased demand.
Higher production costs can lead to higher prices. This is known as cost-push inflation, and the clearest current example is the energy channel. A conflict in the Middle East kept crude and jet fuel expensive through August, which was passed on to consumers as gasoline prices were 22.8% above a year earlier, fuel oil was up 43.7%, and airlines introduced fuel surcharges that lifted travel and tour prices 26.1%. One input cost moved 3 separate CPI components.
When inflation remains high, and expectations are that it will remain high, workers may seek wage increases to offset the higher cost of living. This is known as built-in inflation, which occurs when companies raise prices of their products or services to offset wage increases and maintain profit margins. This creates a loop, or a wage-price spiral. As prices rise, workers demand higher wages to keep up with inflation and the high cost of living, which in turn contributes to further inflation.
Wage growth is the measure to watch for that third channel. Average hourly wages rose 2.0% year-over-year in August, down from 2.8% in July, which is slower than headline inflation. Wages lagging prices is uncomfortable for households and reassuring for the Bank of Canada, because it is the mechanism that would turn an energy shock into persistent inflation.
How to Calculate Inflation Rate
To calculate the inflation rate, you need to know the current price of the good or service and the cost of that good or service in the year you wish to calculate the rate.
Inflation Rate = (Current CPI – Previous CPI) / Previous CPI x 100
This can be applied to the real world for any price of goods or services, as long as you know the previous price. For example, if you want to calculate the inflation rate for a pound of cherries compared to the previous year, you can use the formula above to determine the inflation rate. If cherries were $6.99 a pound in May 2024 and $8.99 a pound in May 2025, you can calculate the inflation rate as follows:
Inflation Rate = ($8.99 – $6.99) / $6.99 x 100
Inflation Rate = 28.61%
The same formula works on the official index. The all-items CPI stood at 169.8 in August 2026, up from 164.8 in August 2025, both on the 2002 = 100 base, which gives (169.8 – 164.8) / 164.8 x 100 = 3.0%.
Who Benefits From Inflation?
Corporations that can raise prices and profit from inflated prices tend to benefit the most from inflation. Specifically, industries like real estate and supermarkets benefit most when inflation is high. Once prices rise due to inflation, they don’t return to previous levels because the increases are broad rather than a one-time spike, as seen when droughts affect lettuce crops. Instead, they stagnate or rise much more slowly once inflation has been tamed.
Borrowers with fixed-rate debt also gain, in a narrower sense. Inflation erodes the real value of a fixed mortgage payment over time, so a payment set in 2026 dollars costs less in purchasing power by the end of a 5-year term. That benefit only holds while the rate itself is locked, which is why it disappears at renewal.
Who Does Inflation Hurt?
Inflation harms consumers, particularly those with low or fixed incomes, by eroding their purchasing power. When earnings remain the same while the cost of everything increases, your money no longer goes as far as it used to. Those with lower incomes or fixed budgets typically spend a significant share of their income on necessities such as rent and food, which are difficult to go without when prices rise. To adjust, they must reduce other spending, which will affect their standard of living.
August shows how unevenly that lands. A renter in Manitoba faced a 4.3% rent increase and provincial inflation of 4.4%, while an Ontario homeowner saw provincial inflation of 2.4%. A household in Nova Scotia heating with fuel oil absorbed a 43.7% increase in that cost alongside the country’s highest provincial inflation rate at 5.1%. The national 3.0% figure does not describe any of them precisely.
We're curious…
Frequently Asked Questions (FAQ) About the Consumer Price Index (CPI)
What is the inflation rate?
The inflation rate measures the rate at which the general price level for goods and services is rising and, consequently, the purchasing power of money is falling. Central banks seek to limit inflation to maintain economic stability.
What is Canada’s current inflation rate?
Canada’s inflation rate was 3.0% year-over-year in August 2026, unchanged from July, according to Statistics Canada. Excluding gasoline, the CPI rose 2.4%. The next CPI release, covering September data, is scheduled for October 19, 2026.
Why is the inflation rate important?
The inflation rate is an important economic indicator because it affects the value of money and indicates the health of an economy. A moderate rate of inflation is generally considered normal in a growing economy. However, high inflation can erode purchasing power and create economic uncertainty.
Why did inflation stay at 3.0% if gasoline prices slowed?
Inflation stayed at 3.0% in August because increases elsewhere offset the slower gasoline growth. Gasoline decelerated to 22.8% year-over-year from 25.7%, which pulled down on the all-items figure, while travel tour prices rose 26.1% and rent rose 2.8%. The clearest evidence of that shift is inflation excluding gasoline, which rose to 2.4% after 3 months at 2.2%.
Which province has the highest inflation rate in Canada?
Nova Scotia had the highest provincial inflation rate in August 2026 at 5.1%, followed by New Brunswick at 4.6%, then Prince Edward Island and Manitoba at 4.4% each. Ontario was the lowest at 2.4%. Fuel oil prices rising 43.7% year-over-year explains much of the Atlantic Canada gap, since fuel oil is more commonly used for home heating in that region.
Are grocery prices still rising faster than inflation?
No. Grocery price growth slowed to 2.8% year-over-year in August 2026 from 3.1% in July, falling below the all-items CPI for the first time since July 2024. Dairy led the deceleration at 0.7%. Prices are still 29.0% higher than in August 2021, so a slower rate of increase is not the same as prices coming down.
How does inflation impact consumers?
Inflation erodes purchasing power, meaning consumers must spend more to afford the same amount of a good or service they used to purchase for less. This affects those with lower incomes or fixed budgets, as a larger share of their income must be spent as prices rise, reducing their standard of living.
What is disinflation?
Disinflation occurs when the pace of price increases slows while prices are still rising. Canada went through a sustained stretch of disinflation in 2023, when headline CPI fell from its 8.1% peak in June 2022 to 3.4% by December 2023 without prices actually falling.
What is deflation?
Deflation is the opposite of inflation and occurs when prices fall rapidly. While this may sound good to those struggling to afford inflated prices, rapidly falling prices can reduce businesses’ profits as consumers become reluctant to spend, waiting for prices to fall further. If falling prices persist, it can lead to job losses and wage cuts, ultimately affecting the entire economy.
Deflation can be a warning signal that a recession is coming or is already underway. An example of prolonged deflation occurred in Canada during the Great Depression, when prices fell significantly, leading to a sharp rise in the unemployment rate.
What are negative real interest rates?
Real interest rates have been adjusted to remove the effects of inflation. This can be calculated as the interest rate minus the headline inflation rate. This calculation more accurately reflects the actual cost of funds for borrowers and the real yield for lenders or investors.
For example, if you have a Canadian bond yielding 4% and inflation is currently 3.0%, your real rate of return is 1.0%. A negative real interest rate results when inflation outpaces the nominal interest rate. For example, a Canadian bond yielding 4% when inflation is 5% implies a negative real rate of return of 1%.
A negative real interest rate occurs in the Canadian economy when the policy rate is lower than the inflation rate. In March 2022, the policy rate was 0.5%, and inflation was 6.7%, resulting in a negative real interest rate of 6.2%.
Final Thoughts
The inflation rate in Canada, as measured by the Consumer Price Index (CPI), held at 3.0% in August 2026 for the second consecutive month, as slower gasoline price growth was offset by higher travel, tour, and rent prices. The Bank of Canada’s core measures stayed near the 2% target, with CPI-trim at 1.9% and CPI-median at 2.0%, while inflation excluding gasoline rose to 2.4%. An unchanged headline hiding a broader base of price pressure is the detail that matters for rates.
Whether you’re a homeowner with a mortgage, a renter, a business owner, or a consumer, monitoring the inflation rate and understanding its implications for your financial strategy, homebuying, and mortgage plans is essential. The next CPI release, covering September, arrives on October 19, 2026, 9 days before the Bank of Canada’s October 28 decision.
Ready to purchase your new home or renew or refinance your mortgage? Contact nesto’s mortgage experts to guide you in making the best decision for your mortgage strategy that suits your financial circumstances.
Why Choose nesto
At nesto, our commission-free mortgage experts are salaried and regulated, with most licensed in multiple provinces. They are evaluated on client satisfaction and the quality of their advice, and they help you compare mortgage options and understand rates and qualification requirements. Once you’re ready to move forward, they work with you on a mortgage strategy that fits your situation.
nesto pairs expert advice with a 100% digital, transparent and seamless process, and a dedicated mortgage professional supports you throughout your purchase, renewal or refinance.
nesto is on a mission to offer a positive, empowering and transparent property financing experience – simplified from start to finish.
Contact our knowledgeable mortgage experts to find your best mortgage rate in Canada.
Let’s get started!
About the contributors