Inflation Rate and CPI in Canada Today

The inflation rate is the rate of increase in the price of goods and services in the Canadian economy over time. Inflation is measured using the Consumer Price Index (CPI), which measures the price movements of a basket of goods and services over time.
The Bank of Canada uses CPI readings to monitor the effects of monetary policy on the economy and adjusts the policy interest rate to bring inflation within the target range. As the fight against inflation continues, Canada’s inflation rate in May rose year-over-year to 3.2%, up from the 2.8% increase in April.
Key Takeaways
- Inflation measures the rate at which the cost of goods and services increases year-over-year.
- When the Bank of Canada makes monetary policy decisions, it monitors CPI-trim, CPI-median, and CPI-common rather than core inflation measures.
- Inflation is typically driven by supply and demand in the economy.
Best Mortgage Rates
Current Inflation Rate in Canada: 3.2%
Inflation rose 3.2% year-over-year, up from the 2.8% increase in April. This increase was driven by higher gasoline prices due to the conflict in the Middle East. Supply uncertainty from the conflict put upward pressure on gasoline prices for the third consecutive month. Gasoline prices rose 33.2% compared to 28.6% in April. However, excluding gasoline, CPI still rose faster year-over-year in May than in April.
The measures of core inflation that the Bank of Canada monitors and uses as the basis for monetary policy decisions remained at 2.0% for CPI-trim and 2.1% for CPI-median. Shelter has consistently been the most significant driver of inflation; however, in May, food (+3.8%), transportation (+9.0%), health and personal care (+2.7%), recreation, education and reading (+2.8%), and clothing and footwear (+1.9%) outpaced shelter (+1.7%).
Inflation by CPI Category May 2026
| CPI Category | CPI |
|---|---|
| Food | 3.8% |
| Shelter | 1.7% |
| Household Operations, Furnishings and Equipment | -0.2% |
| Clothing and Footwear | 1.9% |
| Transport | 9.0% |
| Health and Personal Care | 2.7% |
| Recreation, Education and Reading | 2.8% |
| Alcoholic Beverages, Tobacco Products, and Recreational Cannabis | 1.3% |
Inflation Rates by Province May 2026
| Province | Inflation Rate |
|---|---|
| Newfoundland and Labrador | 4.4% |
| Prince Edward Island | 3.8% |
| Nova Scotia | 5.2% |
| New Brunswick | 4.7% |
| Quebec | 3.6% |
| Ontario | 2.6% |
| Manitoba | 4.6% |
| Saskatchewan | 4.4% |
| Alberta | 3.7% |
| British Columbia | 2.9% |
Shelter Continues to Climb
Canadians continue to feel the impact of rising prices, as shelter prices increased 1.7% year over year. Year-over-year asking rent prices in Canada declined 4.7% in May, following a 4.7% decrease in April. Saskatchewan (+2.3%) and Atlantic Canada (+4.6%) recorded the largest year-over-year increase in rental prices this month. Higher interest rates and population growth have continued to put upward pressure on the Canadian rent index.
Higher interest rates continue to make homebuying more expensive, forcing many to remain in the rental market. This increases competition and impacts rental prices. Shelter costs, including rents, remain one of the 8 CPI components’ most significant drivers of inflation.
What Is Inflation and How Is It Measured
Inflation measures the increase in the cost of goods and services over time. Inflation reduces purchasing power over time, and as inflation increases, your dollar no longer goes as far as it used to.
Inflation is measured using the Consumer Price Index (CPI), which tracks price changes by comparing the retail prices of a basket of goods and services over time. CPI is divided into 8 major categories, each weighted and assigned a share based on the importance of the good or service to consumer spending habits. Basket weights are typically updated annually.
CPI Basket Weights (2025)
| Category | CPI Basket Weight |
|---|---|
| Food | 16.83% |
| Shelter | 28.51% |
| Household Operations, Furnishings and Equipment | 13.16% |
| Clothing and Footwear | 4.50% |
| Transportation | 17.87% |
| Health and Personal Care | 5.40% |
| Recreation, Education, and Reading | 9.96% |
| Alcoholic Beverages, Tobacco Products and Recreational Cannabis | 3.77% |
CPI is calculated based on the percentage change over a 12-month period and is a key indicator of inflationary pressures in the Canadian economy. CPI data are measured in each province and territory and weighted by the importance of that province to consumer spending in Canada.
CPI Basket Weights by Province (2025)
| Geography | Weight |
|---|---|
| Canada | 100% |
| Newfoundland and Labrador | 1.32% |
| Prince Edward Island | 0.36% |
| Nova Scotia | 2.50% |
| New Brunswick | 1.92% |
| Quebec | 20.74% |
| Ontario | 39.76% |
| Manitoba | 3.18% |
| Saskatchewan | 2.85% |
| Alberta | 12.56% |
| British Columbia | 14.63% |
| Whitehorse, Yukon | 0.08% |
| Yellowknife, Northwest Territories | 0.07% |
| Iqaluit, Nunavut | 0.03% |
Best Mortgage Rates
The Bank of Canada’s Preferred Measures of Core Inflation
The Bank of Canada monitors 3 measures of core inflation and uses these readings as the basis for monetary policy decisions.
CPI-trim
This measurement excludes CPI components with extreme price movements in a given month. This measure reduces the impact of volatile changes caused by conditions that affect only a specific component. For example, an extreme drought affecting crop prices could artificially inflate the food component in a given month. CPI-trim removes 40% of the total CPI basket, calculated by removing the highest and lowest 20% of weighted monthly price variations.
CPI-median
This measurement also filters out volatile price movements for components similar to CPI-trim. However, this measurement uses the middle point or median price change out of the range for a component.
CPI-common
This measurement follows price changes that are common across basket categories. A statistical model known as the factor model identifies common variations, filtering out price movements specific to a component.
Is a July Rate Cut a Possibility?
On July 15, the Bank of Canada held its target for the overnight rate at 2.25% for the sixth consecutive decision, leaving the prime rate unchanged at 4.45%. The backdrop looks steadier than it did in the spring: growth rebounded to an estimated 2.5% in the second quarter, and unemployment held at 6.5% in June, within the 6.5% to 7% range it has occupied since late 2024. Inflation is the piece still working itself out. The Middle East conflict has kept oil prices volatile, pushing headline inflation to 3.2% in May, while core measures remained closer to 2%. The Bank expects inflation to ease to about 2.5% in the second half of 2026 and return to the 2% target by early 2027. Governor Tiff Macklem put it plainly:
We will not let higher oil prices become persistent inflation.
Unlike recent statements, the Bank dropped its explicit language on possible consecutive hikes or a trade-driven cut, a sign it now sees the risks as more balanced than pointed in either direction. Bond markets price a high probability of no change on September 2, with a 11% probability of a 25-basis-point hike. By October 28, markets imply a 40% chance of a hike. Read the full Opening Statement and our post-announcement mortgage strategy breakdown for what this means for Canada’s mortgage rates forecast.
Historical Inflation Rates in Canada
The table below presents a 10-year historical overview of Canadian inflation rates from January 2015 to the present.
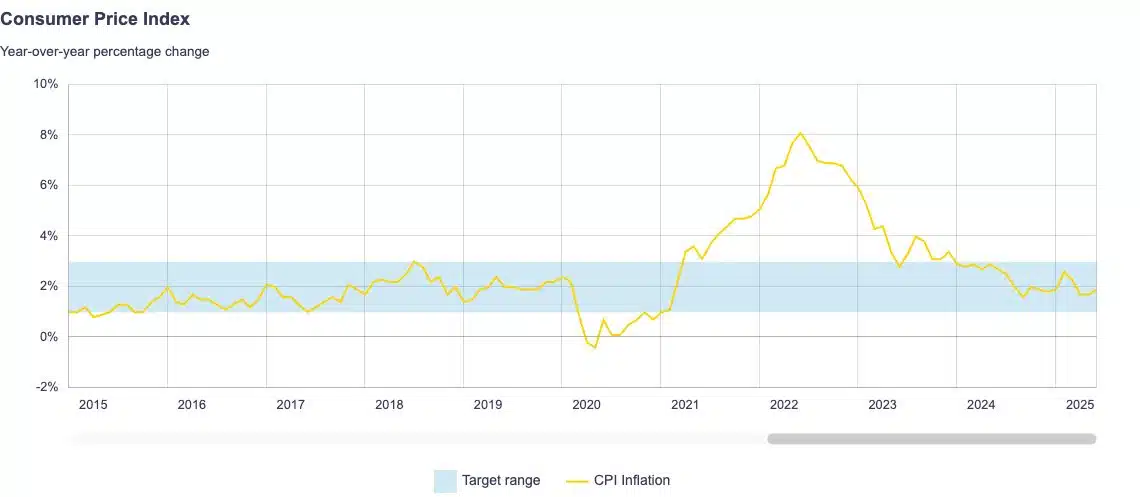
Source: Bank of Canada
| Year | Jan | Feb | Mar | Apr | May | Jun | Jul | Aug | Sep | Oct | Nov | Dec |
|---|---|---|---|---|---|---|---|---|---|---|---|---|
| 2016 | 2.0% | 1.4% | 1.3% | 1.7% | 1.5% | 1.5% | 1.3% | 1.1% | 1.3% | 1.5% | 1.2% | 1.5% |
| 2017 | 2.1% | 2.0% | 1.6% | 1.6% | 1.3% | 1.0% | 1.2% | 1.4% | 1.6% | 1.4% | 2.1% | 1.9% |
| 2018 | 1.7% | 2.2% | 2.3% | 2.2% | 2.2% | 2.5% | 3.0% | 2.8% | 2.2% | 2.4% | 1.7% | 2.0% |
| 2019 | 1.4% | 1.5% | 1.9% | 2.0% | 2.4% | 2.0% | 2.0% | 1.9% | 1.9% | 1.9% | 2.2% | 2.2% |
| 2020 | 2.4% | 2.2% | 0.9% | -0.2% | -0.4% | 0.7% | 0.1% | 0.1% | 0.5% | 0.7% | 1.0% | 0.7% |
| 2021 | 1.0% | 1.1% | 2.2% | 3.4% | 3.6% | 3.1% | 3.7% | 4.1% | 4.4% | 4.7% | 4.7% | 4.8% |
| 2022 | 5.1% | 5.7% | 6.7% | 6.8% | 7.7% | 8.1% | 7.6% | 7.0% | 6.9% | 6.9% | 6.8% | 6.3% |
| 2023 | 5.9% | 5.2% | 4.3% | 4.4% | 3.4% | 2.8% | 3.3% | 4.0% | 3.8% | 3.1% | 3.1% | 3.4% |
| 2024 | 2.9% | 2.8% | 2.9% | 2.7% | 2.9% | 2.7% | 2.5% | 2.0% | 1.6% | 2.0% | 1.9% | 1.8% |
| 2025 | 1.9% | 2.6% | 2.3% | 1.7% | 1.7% | 1.9% | 1.7% | 1.9% | 2.4% | 2.2% | 2.2% | 2.4% |
| 2026 | 2.3% | 1.8% | 2.4% | 2.8% | 3.2% |
What Drives Inflation?
Supply and demand in the economy are typically the key drivers of inflation. Demand for products or services can sometimes exceed the available supply. When this happens, prices are increased to close the gap. This is known as demand-pull inflation, which occurred in the economy recently when businesses laid off employees during the pandemic and then struggled with labour shortages, unable to meet increased demand.
Higher production costs can lead to higher prices. This is known as cost-push inflation, which was most recently evident in lumber prices. Businesses that rely on lumber to produce products were affected by shortages and higher lumber costs. These additional costs are passed on to consumers through price increases, allowing companies to maintain or increase profit margins.
When inflation remains high and expectations are that it will remain high, workers may seek wage increases to offset the higher cost of living. This is known as built-in inflation, which occurs when companies raise prices of their products or services to offset wage increases and maintain profit margins. This creates a loop or a wage-price spiral. As prices rise, workers demand higher wages to keep up with inflation and the high cost of living, which in turn contributes to further inflation.
How to Calculate Inflation Rate
To calculate the inflation rate, you need to know the current price of the good or service and the cost of that good or service in the year you wish to calculate the rate.
Inflation Rate = (Current CPI – Previous CPI) / Previous CPI x 100
This can be applied to the real world for any price of goods or services, as long as you know the previous price. For example, if you want to calculate the inflation rate for a pound of cherries compared to the previous year, you can use the formula above to determine the inflation rate. If cherries were $6.99 a pound in May 2024 and $8.99 a pound in May 2025, you can calculate the inflation rate as follows:
Inflation Rate = ($8.99 – $6.99) / $6.99 x 100
Inflation Rate = 28.61%
Who Benefits From Inflation?
Corporations that can raise prices and profit from inflated prices tend to benefit the most from inflation. Specifically, industries like real estate and supermarkets benefit most when inflation is high. Once prices rise due to inflation, they don’t return to previous levels because the increases are broad rather than a one-time spike, as seen when droughts affect lettuce crops. Instead, they stagnate or rise much more slowly once inflation has been tamed.
Who Does Inflation Hurt?
Inflation harms consumers, particularly those with low or fixed incomes, by eroding their purchasing power. When earnings remain the same while the cost of everything increases, your money no longer goes as far as it used to. Those with lower incomes or fixed budgets typically spend a significant share of their income on necessities such as rent and food, which are difficult to go without when prices rise. To adjust, they must reduce other spending, which will affect their standard of living.
Frequently Asked Questions
What is the inflation rate?
The inflation rate measures the rate at which the general price level for goods and services is rising and, consequently, the purchasing power of money is falling. Central banks seek to limit inflation to maintain economic stability.
Why is the inflation rate important?
The inflation rate is an important economic indicator because it affects the value of money and indicates the health of an economy. A moderate rate of inflation is generally considered normal in a growing economy. However, high inflation can erode purchasing power and create economic uncertainty.
How does inflation impact consumers?
Inflation erodes purchasing power, meaning consumers must spend more to afford the same amount of a good or service they used to purchase for less. This affects those with lower incomes or fixed budgets, as a larger share of their income must be spent as prices rise, reducing their standard of living.
What is disinflation?
Disinflation occurs when the pace of price increases slows. This means prices are still rising, but at a much slower rate than before. Canada is currently in a disinflationary period, with inflation decreasing and price growth for goods and services moderating.
What is deflation?
Deflation is the opposite of inflation and occurs when prices fall rapidly. While this may sound good to those struggling to afford inflated prices, rapidly falling prices can reduce businesses’ profits as consumers become reluctant to spend, waiting for prices to fall further. If falling prices persist, it can lead to job losses and wage cuts, ultimately affecting the entire economy.
Deflation can be a warning signal that a recession is coming or is already underway. An example of prolonged deflation occurred in Canada during the Great Depression, when prices fell significantly, leading to a sharp rise in the unemployment rate.
What are negative real interest rates?
Real interest rates have been adjusted to remove the effects of inflation. This can be calculated as the interest rate minus the headline inflation rate. This calculation more accurately reflects the actual cost of funds for borrowers and the real yield for lenders or investors.
For example, if you have a Canadian bond yielding 4% and inflation is currently 2.9%, your real rate of return is 1.1%. A negative real interest rate results when inflation outpaces the nominal interest rate. For example, a Canadian bond yielding 4% when inflation is 5% implies a negative real rate of return of 1%.
A negative real interest rate occurs in the Canadian economy when the policy rate is lower than the inflation rate. In March 2022, the policy rate was 0.5%, and inflation was 6.7%, resulting in a negative real interest rate of 6.2%.
Final Thoughts
The inflation rate in Canada, as measured by the Consumer Price Index (CPI), is an important economic indicator currently standing at 3.2%. The Bank of Canada monitors various CPI metrics to guide its monetary policy decisions and strives to maintain inflation within its target range, with implications for the overall economy and interest rates.
Whether you’re a homeowner with a mortgage, a renter, a business owner, or a consumer, monitoring the inflation rate and understanding its implications for your financial strategy, homebuying, and mortgage plans is essential.
Ready to purchase your new home or renew/refinance your mortgage? Contact nesto’s mortgage experts to guide you in making the best decision for your mortgage strategy that suits your financial circumstances.
Why Choose nesto
At nesto, our commission-free mortgage experts, certified in multiple provinces, provide exceptional advice and service that exceeds industry standards. Our mortgage experts are salaried employees who provide impartial guidance on mortgage options tailored to your needs and are evaluated based on client satisfaction and the quality of their advice. nesto aims to transform the mortgage industry by providing honest advice and competitive rates through a 100% digital, transparent, and seamless process.
nesto is on a mission to offer a positive, empowering and transparent property financing experience – simplified from start to finish.
Contact our licensed and knowledgeable mortgage experts to find your best mortgage rate in Canada.