Quebec Housing Market Outlook 2026
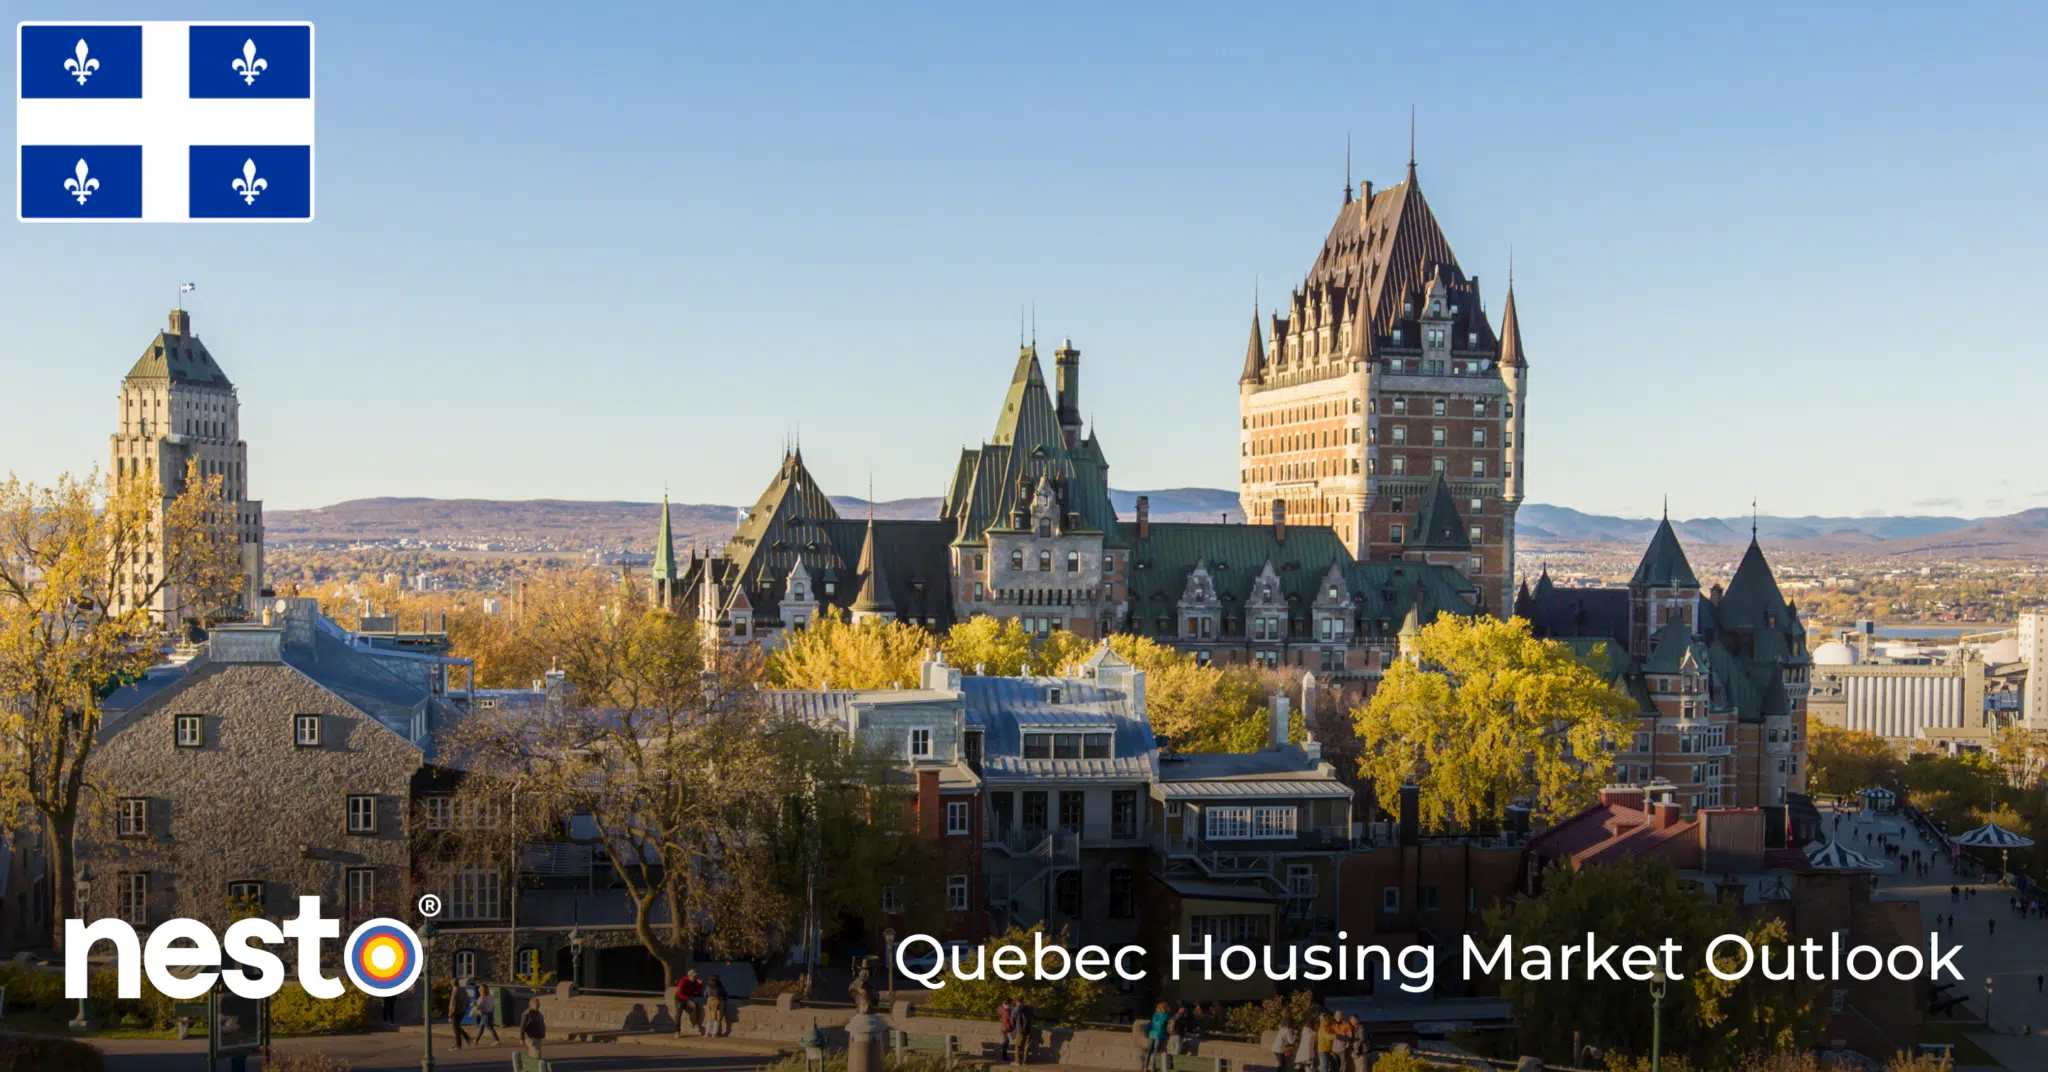
Quebec Buyers Gain Choice as Sales Slip and Supply Climbs
According to the Quebec Professional Association of Real Estate Brokers (QPAREB), Centris recorded 7,045 residential sales across Quebec in September 2026, down 7% from September 2025. New listings rose 13% to 15,378, and active listings jumped 23% to 45,185.
- Centris median prices rose 3% YoY to $498,500 for single-family homes and 4% YoY to $687,553 for plexes, while condo prices were flat at $400,000.
- Single-family sales fell 4% YoY to 4,819, while condo sales and plex sales each fell 13% YoY to 1,515 and 689. Total sales volume was $3.9 billion, down 6%.
- Calculated by nesto from QPAREB’s Centris counts, the sales-to-new-listings ratio (SNLR) was 45.8%, down from 55.6% a year earlier, as listings grew while sales shrank.
The condo segment shows the shift most clearly. Condo sales fell 13%, active condo listings rose 22% to 13,233 and the average time to sell stretched to 62 days from 48 a year earlier. Single-family homes held up better, with active listings up 23% to 26,543 and the median price still rising.
To see how a wider choice of homes affects your options, connect with our nesto mortgage experts and compare mortgage rates in Quebec.
Best Mortgage Rates
Quebec Housing Market Highlights
- The average selling price of a home in Quebec increased by 1.13% year-over-year to $537,100 in September 2026.
- The average selling price of a single-family home in Quebec increased by 1.60% year-over-year to $610,400 in September 2026.
- The average selling price of a townhouse/multiplex in Quebec increased by 2.75% year-over-year to $598,000 in September 2026.
- The average selling price of a condo in Quebec increased by 0.86% year-over-year to $408,900 in September 2026.
- October 28, 2026: Today’s lowest mortgage rate in Québec is 4.59% for a 5-year fixed.
Data from the Quebec Professional Association of Real Estate Brokers (QPAREB) indicates that the average price of resale residential homes sold across Quebec in September 2026 was $537,100, and it increased by 1.13% compared to a year ago.
QPAREB also reported a sales-to-new-listings ratio (SNLR) of 45.8%, indicating balanced market conditions in Quebec for September 2026.
| Quebec | Composite Price September 2026 | Composite Price August 2026 | YoY Change (%) | MoM Change (%) |
|---|---|---|---|---|
| Single Family Home | $610,400 | $611,800 | increased by 1.60% | decreased by 0.23% |
| Townhouse/Multiplex | $598,000 | $587,800 | increased by 2.75% | increased by 1.74% |
| Condo / Apartments | $408,900 | $417,500 | increased by 0.86% | decreased by 2.06% |
| Composite | $537,100 | $540,800 | increased by 1.13% | decreased by 0.68% |
Quebec Home Price Changes Over The Last Decade
Composite Home Prices

The average selling price of a home in Quebec was $537,100 for the month of September 2026, that’s decreased by 0.68% month-over-month. On a year-over-year basis, Quebec home prices have increased by 1.13%.
Composite Home Prices in Quebec
Monthly changes to Quebec’s composite home prices over the last 10 years.
Single-family Home Prices

The average selling price of a single-family home in Quebec was $610,400 for the month of September 2026; that’s decreased by 0.23% month-over-month. On a year-over-year basis, single-family home prices in Quebec have increased by 1.60%.
Single-Family Home Prices in Quebec
Monthly changes to Quebec’s single-family home prices over the last 10 years.
Townhouse and Multiplex Prices

The average selling price of a townhouse in Quebec was $598,000 for the month of September 2026; that’s increased by 1.74% month-over-month. On a year-over-year basis, the price of a townhouse in Quebec has increased by 2.75%.
Townhouse and Multiplex Prices in Quebec
Monthly changes to Quebec’s townhouse and multiplex home prices over the last 10 years.
Condo Prices
The average selling price of a condo in Quebec was $408,900 for the month of September 2026; that’s decreased by 2.06% month-over-month. On a year-over-year basis, the price of a condo in Quebec has increased by 0.86%.
Condo Prices in Quebec
Monthly changes to Quebec’s condominium apartment home prices over the last 10 years.
Quebec Housing Market Conditions
Number of Home Sales

The number of home sales in Quebec was 7,045 during September 2026, that’s increased by 8.35% month-over-month. On a year-over-year basis, sales in Quebec have decreased by 7.85%.
Home Sales in Quebec
Quebec’s home sale transactions over the past 12 months.
New Listings

The number of new listings in Quebec was 15,378 during September 2026, that’s increased by 23.20% month-over-month. On a year-over-year basis, new listings in Quebec have increased by 10.19%.
New Listings in Quebec
Quebec’s new listings over the past 12 months.
Sales-to-New-Listings Ratio (SNLR)

The sales-to-new-listings ratio (SNLR) in Quebec was 45.8% during September 2026, indicating a balanced market. On a monthly basis, that’s decreased by 12.09% month-over-month. Quebec’s yearly sales-to-new-listings ratio has decreased by 16.42%.
SNLR in Quebec
Monthly change in Quebec’s sales-to-new-listings ratio (SNLR) over the past 12 months.
The sales-to-new-listings ratio (SNLR) measures home sales relative to new listings. An SNLR below 40% indicates a buyer’s market, where buyers hold the upper hand and greater negotiating power. An SNLR between 40% and 60% indicates a balanced market, while an SNLR over 60% indicates a seller’s market.
Market Conditions in Quebec
| Oct 2025 | sellers market |
| Nov 2025 | sellers market |
| Dec 2025 | sellers market |
| Jan 2026 | balanced market |
| Feb 2026 | balanced market |
| Mar 2026 | sellers market |
| Apr 2026 | sellers market |
| May 2026 | sellers market |
| Jun 2026 | sellers market |
| Jul 2026 | sellers market |
| Aug 2026 | balanced market |
| Sep 2026 | balanced market |
SNLR — last 12 months
Monthly change in Quebec’s market conditions over the past 12 months.
Short-Term Composite Home Price Trend in Quebec
Monthly changes to Quebec’s composite home prices over the last 12 months.
Regional Composite Home Price Changes in Quebec
| Region | Composite Price September 2026 | Composite Price August 2026 | YoY Change (%) | MoM Change (%) |
|---|---|---|---|---|
| Central Quebec | $366,600 | $362,400 | increased by 8.62% | increased by 1.16% |
| Estrie | $475,400 | $495,700 | increased by 7.31% | decreased by 4.10% |
| Mauricie | $331,200 | $336,200 | increased by 6.09% | decreased by 1.49% |
| Montreal | $578,200 | $583,900 | increased by 0.02% | decreased by 0.98% |
| Quebec City | $445,800 | $436,100 | increased by 4.70% | increased by 2.22% |
Quebec Market Rents Snapshot
The average rent in Quebec was $1,933 in September 2026 and decreased by 1.68% year-over-year.
The average rent for a 1-bedroom apartment in Quebec was $1,694 in September 2026 and increased by 0.30% year-over-year.
The average rent for a 2-bedroom apartment in Quebec was $2,144 in September 2026 and decreased by 0.14% year over year.
Average Rents for Cities Across Canada
| Rank | City | Total Avg | 1 Bed | 2 Bed |
|---|---|---|---|---|
| 1 | North Vancouver | $3,028 | $2,466 | $3,477 |
| 2 | Vancouver | $2,754 | $2,373 | $3,271 |
| 3 | Burnaby | $2,564 | $2,111 | $2,785 |
| 4 | Toronto | $2,556 | $2,220 | $2,937 |
| 5 | North York | $2,528 | $2,093 | $2,692 |
| 6 | Kanata | $2,501 | $2,265 | $2,691 |
| 7 | Coquitlam | $2,482 | $2,053 | $2,608 |
| 8 | Oakville | $2,460 | $2,165 | $2,703 |
| 9 | Etobicoke | $2,431 | $2,099 | $2,644 |
| 10 | Barrie | $2,397 | $2,148 | $2,552 |
| 11 | Burlington | $2,379 | $2,074 | $2,389 |
| 12 | Vaughan | $2,363 | $2,114 | $2,569 |
| 13 | Mississauga | $2,337 | $2,036 | $2,423 |
| 14 | Halifax | $2,324 | $2,002 | $2,508 |
| 15 | Brampton | $2,261 | $1,990 | $2,334 |
| 16 | Victoria | $2,253 | $1,987 | $2,632 |
| 17 | New Westminster | $2,241 | $1,881 | $2,734 |
| 18 | Langley | $2,239 | $1,868 | $2,426 |
| 19 | Surrey | $2,227 | $1,807 | $2,251 |
| 20 | Guelph | $2,225 | $1,961 | $2,292 |
| 21 | Ajax | $2,214 | $1,927 | $2,294 |
| 22 | Ottawa | $2,200 | $1,969 | $2,445 |
| 23 | Scarborough | $2,178 | $1,855 | $2,315 |
| 24 | Waterloo | $2,158 | $1,884 | $2,302 |
| 25 | Nanaimo | $2,157 | $1,897 | $2,261 |
| 26 | Kingston | $2,150 | $1,930 | $2,308 |
| 27 | Laval | $2,131 | $1,712 | $2,364 |
| 28 | Kelowna | $2,111 | $1,834 | $2,270 |
| 29 | Brossard | $2,083 | $1,790 | $2,190 |
| 30 | Cambridge | $2,055 | $1,863 | $2,143 |
| 31 | East York | $2,044 | $1,800 | $2,355 |
| 32 | Airdrie | $2,013 | $1,466 | $1,750 |
| 33 | Oshawa | $1,993 | $1,724 | $2,006 |
| 34 | Niagara Falls | $1,988 | $1,714 | $1,960 |
| 35 | Greater Sudbury | $1,982 | $1,745 | $2,076 |
| 36 | Montreal | $1,961 | $1,746 | $2,261 |
| 37 | Kamloops | $1,957 | $1,701 | $2,023 |
| 38 | Kitchener | $1,935 | $1,709 | $2,063 |
| 39 | Peterborough | $1,926 | $1,692 | $1,964 |
| 40 | Brantford | $1,923 | $1,780 | $2,033 |
| 41 | Hamilton | $1,910 | $1,657 | $2,130 |
| 42 | London | $1,897 | $1,628 | $1,998 |
| 43 | Calgary | $1,883 | $1,508 | $1,834 |
| 44 | St. Catharines | $1,830 | $1,518 | $1,959 |
| 45 | Welland | $1,792 | $1,540 | $1,920 |
| 46 | Gatineau | $1,769 | $1,625 | $1,810 |
| 47 | Côte Saint-Luc | $1,655 | $1,410 | $1,875 |
| 48 | Winnipeg | $1,653 | $1,435 | $1,764 |
| 49 | Windsor | $1,638 | $1,467 | $1,843 |
| 50 | Edmonton | $1,633 | $1,281 | $1,643 |
| 51 | Quebec City | $1,620 | $1,308 | $1,642 |
| 52 | Red Deer | $1,614 | $1,338 | $1,503 |
| 53 | Sarnia | $1,583 | $1,408 | $1,642 |
| 54 | Lethbridge | $1,573 | $1,355 | $1,558 |
| 55 | Saskatoon | $1,559 | $1,305 | $1,536 |
| 56 | Regina | $1,468 | $1,305 | $1,521 |
| 57 | Lloydminster | $1,392 | $1,108 | $1,422 |
| 58 | Fort McMurray | $1,386 | $1,147 | $1,372 |
| 59 | St. John's | $1,362 | $1,167 | $1,328 |
| 60 | Medicine Hat | $1,360 | $1,232 | $1,391 |
Source: Rentals.ca Network Data & Urbanation Inc.
Average Rent by Province
| LOCATION | Total | 1B | 2B | 3B |
|---|---|---|---|---|
| AB | $1,780 | $1,409 | $1,745 | $2,177 |
| BC | $2,231 | $1,904 | $2,355 | $2,850 |
| MB | $2,403 | $2,045 | $2,649 | $3,313 |
| ON | $1,649 | $1,428 | $1,751 | $2,008 |
| QC | $2,240 | $1,963 | $2,410 | $2,902 |
| SK | $1,933 | $1,694 | $2,144 | $2,558 |
| Atlantic Canada | $1,490 | $1,284 | $1,504 | $1,993 |
| Canada | $2,034 | $1,756 | $2,138 | $2,489 |
Average Rent by Property Type Across Canada
| TYPE | Total | 1B | 2B | 3B |
|---|---|---|---|---|
| Apartment | $2,036 | $1,799 | $2,221 | $2,715 |
| Condominium | $2,052 | $1,844 | $2,161 | $2,769 |
| House/Townhouse | $2,016 | $1,311 | $1,732 | $2,299 |
| All | $2,034 | $1,756 | $2,138 | $2,489 |
How Does Renting Compare With Homeownership in Quebec?
Each $100,000 in mortgage balance costs an average of $564 per month on nesto’s lowest fixed 5-year rate at 4.59%, and $503 per month on nesto’s lowest adjustable 5-year rate at 3.41%.
On the variable side, a 0.25% change in the Bank of Canada’s policy rate moves that payment by roughly $13.47 per $100,000 if rates rise, or $13.27 if they fall. Fixed payments aren’t affected the same way mid-term—a fixed rate is locked for the term and tracks bond yields, not the policy rate directly, so this sensitivity applies only to the variable side.
The interest rates used for the calculation are those offered on insured purchases with less than a 20% down payment, on a 25-year amortization, as of October 28, 2026 and are subject to change. Canada’s policy rate is 2.25%, and nesto’s prime rate is 4.45%.
We're curious…
Frequently Asked Questions (FAQ) About the Quebec Housing Market in 2026
Are Quebec Housing Market Conditions Favouring Buyers or Sellers in 2026?
Quebec housing market conditions are balanced in 2026, with the advantage shifting gradually toward buyers. The sales-to-new-listings ratio (SNLR) that nesto calculated from QPAREB’s Centris counts was 45.8% in September, inside the 40% to 60% range that marks a balanced market, because listings grew while sales shrank. Active listings jumped 23% to 45,185, and sales fell 7% from September 2025, giving buyers more choice, although single-family homes held up better, with the Centris median price rising 3% to $498,500.
Are Home Prices in Quebec Going Up or Down in 2026?
Home prices in Quebec are edging up in 2026, setting the province apart from Ontario and British Columbia. CREA’s MLS HPI composite benchmark for Quebec was $537,100 in September, up 1.1% year over year though 0.7% lower than in August, while Ontario’s benchmark fell 4.0% year over year to $736,300 and British Columbia’s average residential price fell 2.4% according to BCREA. Separately, Centris median prices rose 3% to $498,500 for single-family homes and 4% to $687,553 for plexes, while condominium medians were flat at $400,000. Centris medians and the HPI benchmark measure different things and are not directly comparable.
Why Is Quebec Rebalancing Through Inventory Instead of Price?
Quebec is rebalancing through inventory rather than price because supply is rebuilding fastest in the segments where sales are weakening. Active listings rose 23% in September to 45,185, including a 22% rise to 13,233 in condominiums, where sales fell 13% and the average time to sell stretched to 62 days from 48. Plex sales also fell 13% to 689, even as the median plex price rose 4% to $687,553, suggesting thin volume rather than weak pricing. The result is a balanced SNLR of 45.8%, calculated by nesto from QPAREB’s Centris counts, while median prices for single-family homes and plexes kept rising.
What Quebec Property Type Is Softening Fastest?
Condominiums are softening fastest in Quebec, with weaker volume and price momentum than other property types. September condominium sales fell 13% year over year to 1,515 while active listings climbed 22% to 13,233, the average time to sell stretched to 62 days from 48, and the median price was flat at $400,000. Plex sales also fell 13%, to 689, but the median plex price rose 4% to $687,553, suggesting a supply shortage in that category rather than softer demand.
Is Quebec Still More Affordable Than Ontario and British Columbia?
Quebec remains more affordable than Ontario and British Columbia in 2026, with an MLS HPI composite benchmark of $537,100 against Ontario’s $736,300 in September. British Columbia’s average residential price was $924,279, according to BCREA, a different measure not directly comparable to the HPI benchmark. The advantage is narrowing, however, because Quebec’s benchmark rose 1.1% year over year while Ontario’s fell 4.0% and British Columbia’s average price fell 2.4%, and the mortgage stress test applies the same qualifying standard regardless of where you buy.
What Is Limiting Quebec Housing Demand in 2026?
Borrowing costs and qualification are the main factors limiting housing demand in Quebec in 2026. CREA’s senior economist tied the national pullback in September to a fresh jump in fixed mortgage rates, and the Bank of Canada’s policy rate has been 2.25% since October 2025, with its next decision on October 28, 2026. The mortgage stress test also requires borrowers to qualify at a rate above the one they will actually pay. Quebec’s September sales fell 7% year over year to 7,045 even as active listings rose 23%.
Is It Cheaper to Rent or Buy in Quebec in 2026?
Renting is still cheaper month to month than buying across most of Quebec in 2026, and the gap is widening. Rentals.ca put Quebec’s average asking rent at $1,933 in September, down 1.7% from a year earlier, while CREA’s MLS HPI composite benchmark for the province rose 1.1% year over year, so the monthly cost of owning is moving away from the cost of renting rather than toward it. Over time, the cheaper option depends on how long it takes to save the down payment, how long you plan to stay and the mortgage rate you qualify for.
Why Choose nesto
At nesto, our commission-free mortgage experts are salaried and regulated, with most licensed in multiple provinces. They are evaluated on client satisfaction and the quality of their advice, and they help you compare mortgage options and understand rates and qualification requirements. Once you’re ready to move forward, they work with you on a mortgage strategy that fits your situation.
nesto pairs expert advice with a 100% digital, transparent and seamless process, and a dedicated mortgage professional supports you throughout your purchase, renewal or refinance.
nesto is on a mission to offer a positive, empowering and transparent property financing experience – simplified from start to finish.
Contact our knowledgeable mortgage experts to find your best mortgage rate in Canada.
Let’s get started!
About the contributors